Visualize your New Customer segments in HubSpot so you can automatically or manually follow up with them at the right time to close a 2nd sale. With at least 50% of Ecommerce customers never making a 2nd purchase, this is a critical area for business visibility and action.
Are your New Customers progressing and growing in value?
I've written on how to write email content for brand new customers. But once they've passed that Active stage of getting their 1st order in the mail and putting it to use, what can you do to close that 2nd sale?
Splitting New Customers into 4 Segments
"One Size Fits All. Batch & Blast. Spray & Pray." Although it's frowned upon to send the same message to all customers, few marketers and store owners have solid enough insights of their customer base to send targeting messaging to their specific needs. This is known for us as Ecommerce Customer Segmentation.
We want to break down your New Customers into 4 distinct groups so that you can visualize and easily target your segments to send the right message to close the 2nd sale:
Segment #1: Active
Your New Customers who are anywhere from waiting for their order to come in the mail to putting their first purchase to use.
Marketing Actions: Remove these customers from all other automatic campaigns and keep them out of your broadcast newsletters. Additional emails cloud their onboarding process - especially if they're sales promotions - so you want to focus them on getting the most out of their 1st purchase as possible with your targeted New Customer onboarding content, which I've described in depth here.)
Segment #2: Drifting
Your New Customers who are drifting outside of the normal range of making a 2nd purchase. They're not a churn risk yet, but re-engage these customers with relevant product recommendations and social proof to keep your brand top of mind.
(Marketing Actions: These customers can be part of your regular newsletter and promotion emails, and you can send automatic emails with product grids of items new customers commonly make in their next purchase. If you WANT to make sure you close the sale, you can implement a discount offer over several emails; it's decision over whether you want to risk your marketing dollars or risk them not buying at all in the next "Churn Risk" phase.)
Segment #3: Churn Risk
At this point, customers are way past their optimum repurchase timeframe and they have not responded to the previous engagement tactics.
Marketing Actions: Keep the communication frequency low, but consistent. Remove these customers from all other automated campaigns besides your Win Back campaign and new store actions they take like abandoning a cart. Send no more than 1 email a week, at most, to make sure that each follow up touch point is high-quality.
Segment #4: Lost
Your New Customers who have far, far past the normal range of making a 2nd purchase and are functionally "Lost" to your business. Despite your best efforts you'll never retain all your customers, nor be able to attract the types of customers who are prone to repeat buying.
Marketing Actions: Lost customers should be left to the automated newsletter list. Some non-monetary value this segment can provide is product learning: Give these customers an incentive so they can tell you what you should to do improve your offerings.
Setting Up Your "Recency" Data
So how do you know how long you should wait before considering a New Customer to be "Drifting", "Churn Risk", or "Lost"?
Without getting into complicated Excel analysis, you can take an educated guess based on your average days between orders.
This is called a "Recency Analysis" and is one of the 3 parameters available in an RFM Analysis. Putting your customers into 5 different groups according to how Recently they last bought is the most effective way to segment marketing messages to these New Customers.
(We're only going to only focus on "Recency" since we know that these New Customers' "Frequency" of purchase is only "1" and we'll save a "Monetary" rating for another time)
So just use your intuition and estimate what your Average Days Between Orders is for your customer base.
Let's say it's 107 days.
For each of the 5-Star Recency ratings, you'll use the next multiple of this 107 day range:
- 5-Stars is customers who've last bought within 107 days
- 4-Stars is the remaining customers who've last bought within 214 days (107 x 2)
- 3-Stars is the remaining customers who've last bought within 321 days (74 x 3)
- 2-Stars is the remaining customers who've last bought within 428 days (74 x 4)
- 1-Star is the remaining customers who've last bought in over 428 days (74 x 4) (we'll still use the same date for the last section)
Save those numbers you've calculated for your business and we'll implement them next in HubSpot!
Here's how we're going to apply these numbers according to the 4 Segments:
- Active - Recency Rating 5
- Drifting - Recency Rating 4
- Churn Risk - Recency Rating 3 & 2 (because New Customers are less likely to repeat purchase than customers who've bought 2 or 3+ times we're going to group these into one status)
- Lost - Recency Rating 1
We've built our Customer Journey Analysis to split your customers' days since last purchase into 5 equal groups (or "Quintiles") so that your customers' last purchase day are represented by 5 equally-sized groups, but this quick method above can get you the results you need for visibility without needing your own Excel analysis.
HubSpot Implementation "How-To"
This shouldn't take you more than about an hour to implement! At the end you'll be able to clearly visualize all 4 New Customer Segments for taking marketing action.
This New Customer reporting system will require the following HubSpot elements:
- 2 custom HubSpot Properties
- 5 HubSpot Active Lists
- 1 HubSpot Static List
- 1 HubSpot Contact Workflow
- 1 HubSpot Report
I'm breaking the HubSpot implementation into 3 groups:
Step #1: HubSpot Properties and Lists
In the property management area of HubSpot, go ahead and create these two properties in HubSpot:
- Customer Segment - Property type: Single-line text
- Customer Recency Rating - Property type: Dropdown select, with these following values in this order:
- 5 Stars
- 4 Stars
- 3 Stars
- 2 Stars
- 1 Star
You might be sensibly asking, "Why make the Customer Recency Rating a dropdown rather than just a number field?" It's because we'll want to use this "star rating" value as a way to group up customer results when building HubSpot Reports.
There isn't really any value in doing math operations on this rating field like "sum" or "average" since it's really just a way to group customers into one of 5 categories. Since HubSpot reports does NOT allow display grouping for number fields and only allows this for dates, dropdown, multi-select, and single/multi-line text, this forces us to chose one of those for the sake of our reports: a Dropdown select is the best fit for this field.
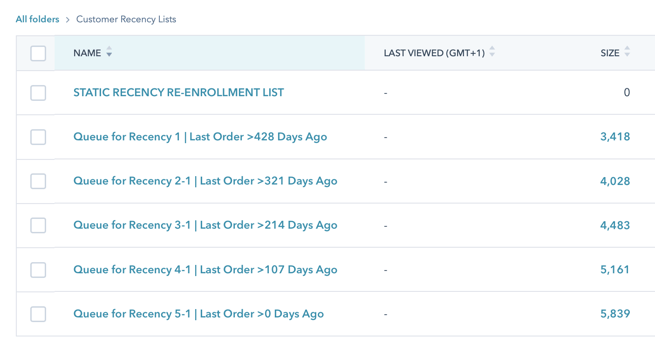
Then you'll need to create these following 5 HubSpot Active Lists (and I'm using the "day" Recency criteria from the previously defined segments, so use your own in building these):
- Queue for Recency 1 | Last Order >428 Days Ago
- Queue for Recency 2-1 | Last Order >321 Days Ago
- Queue for Recency 3-1 | Last Order >214 Days Ago
- Queue for Recency 4-1 | Last Order >107 Days Ago
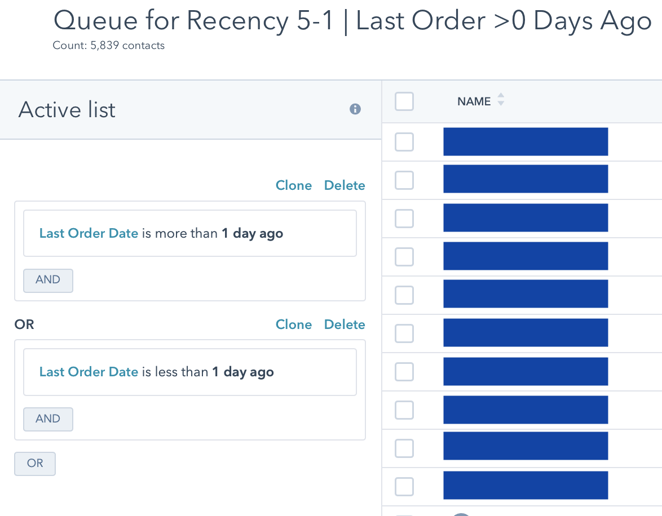
- Queue for Recency 5-1 | Last Order >0 Days Ago
As you might be able to see, the bottom list will contain all of the contacts of the previous upper lists. Essentially, we're going to use a workflow to evaluate whether a contact is in each list starting with the first list (Recency 1) and working our way down (Recency 5) to see which Recency segment they should be added to.
The first four lists are built using very similar criteria, which is also clearly stated in their name:
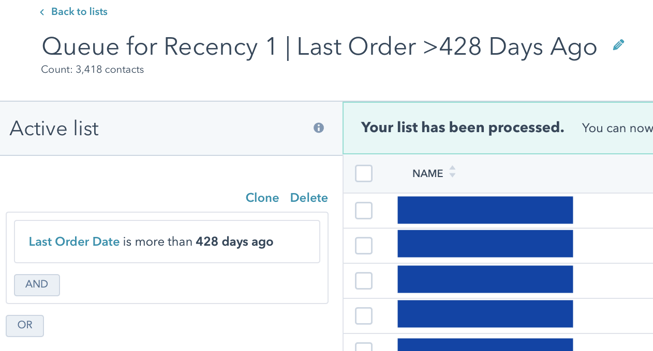
Select the Unific Contact Property Last Order Date and set it to "is more than 428 days ago", and do the same for creating the other first 4 lists.
The final Active List ("Queue for Recency 5-1 | Last Order >0 Days Ago") will require similar criteria, but will also require an "OR" criteria setting "Last Order Date is less than 1 day ago" to include all orders from today (HubSpot doesn't allow "greater than 0 days ago" so this is the only special work-around that's required for this final list):
Finally, create a Static List with the name of "STATIC RECENCY RE-ENROLLMENT LIST" and save it. It'll have 0 contacts in it. This will only be used for if you ever decide to update or change your Recency date ranges, which I'll explain in the last section.
At the end you should have these 6 HubSpot lists, which you can put into a folder if you prefer:
Step #2: HubSpot Workflow Creation
Now for the fun part!
Go ahead and create a blank Contact Workflow with a name like "Recency Rating & New Customer Segment" and give it these enrollment triggers:
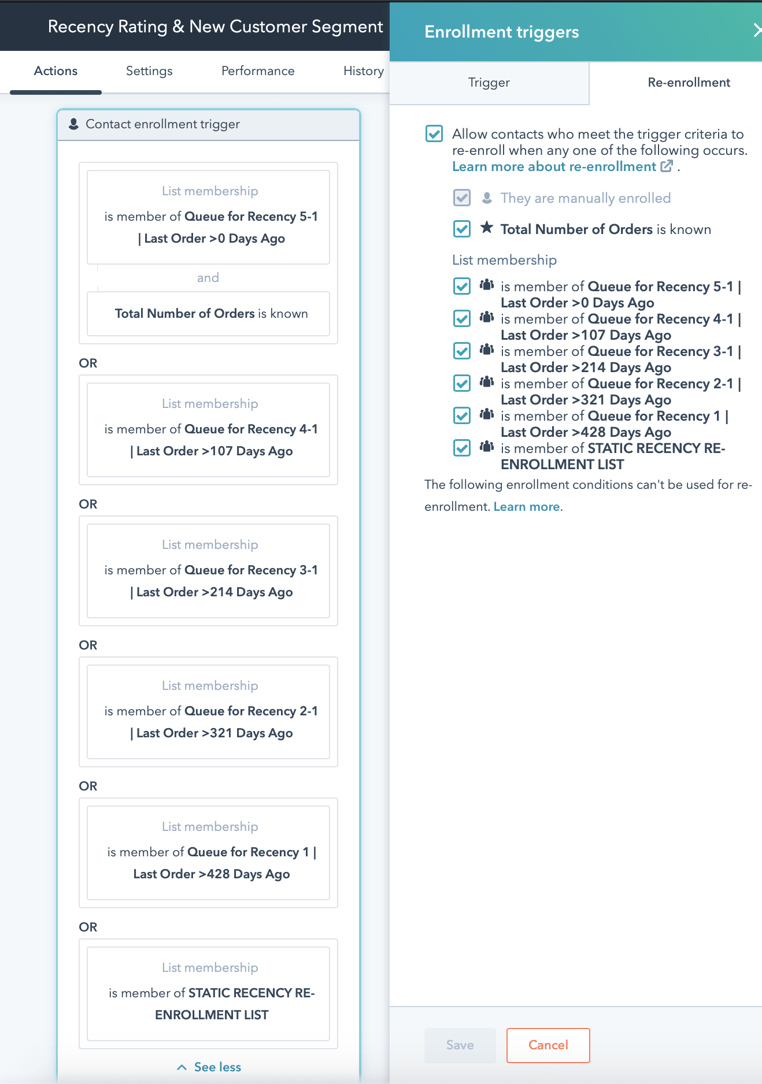
The order you add these doesn't matter at this stage (it'll matter in the if/then stage actions afterwards), just that each "OR" criteria is set up correctly and you have the re-enrollment triggers in place.
When a contact's Last Order Date is long enough ago that they move into the "Queue for Recency 4" or "Recency 3" list, them being present in that list will re-enroll them in the workflow.
The reason that "Total Number of Orders is known" is a re-enrollment criteria (since contacts will ALWAYS be in the "Queue for Recency 5-1 | Last Order >0 Days Ago" list) is to pay attention whenever they move from 1 to 2 orders, which will also re-enroll them in the workflow.
I'll explain the "STATIC RECENCY RE-ENROLLMENT LIST" in the last section of this article, but just put them into the trigger criteria for now with re-enrollment enabled.
Now onto the actions!
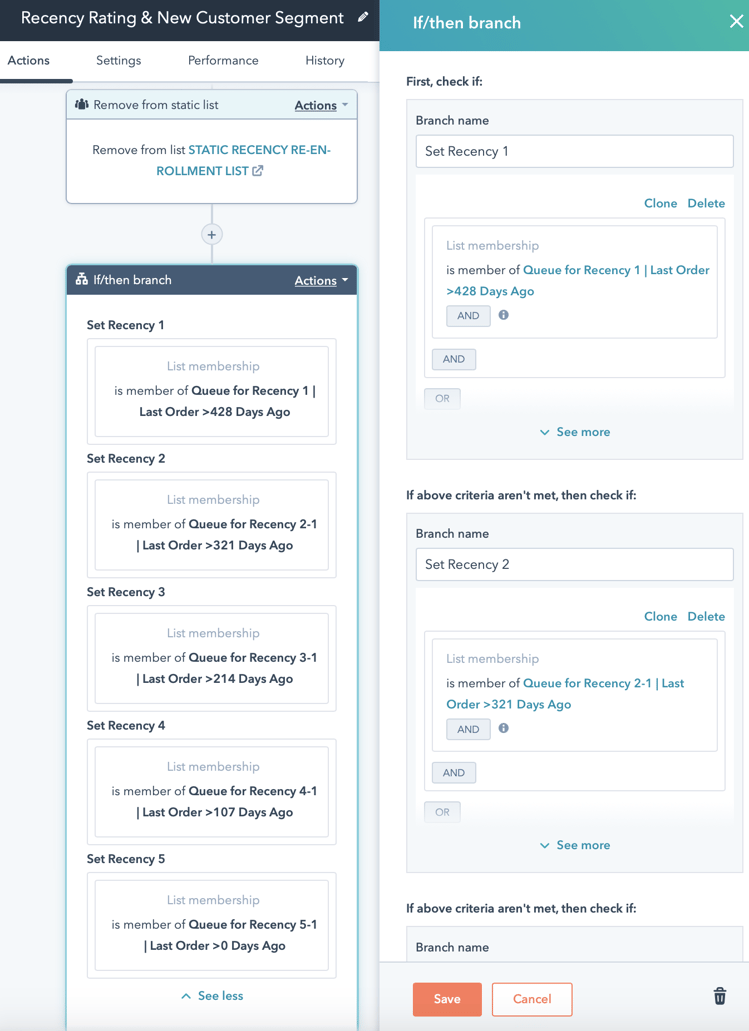
Start with a "Remove from Static List" action and enter "STATIC RECENCY RE-ENROLLMENT LIST", which I'll explain later.
The next action is an if/then branch with the 5 actions listed above. These actions need to be in this EXACT order to evaluate the customer segments starting with Recency 1 and ending in Recency 5. (you can also label the if/then branches as I've done above to make the next steps more clear).
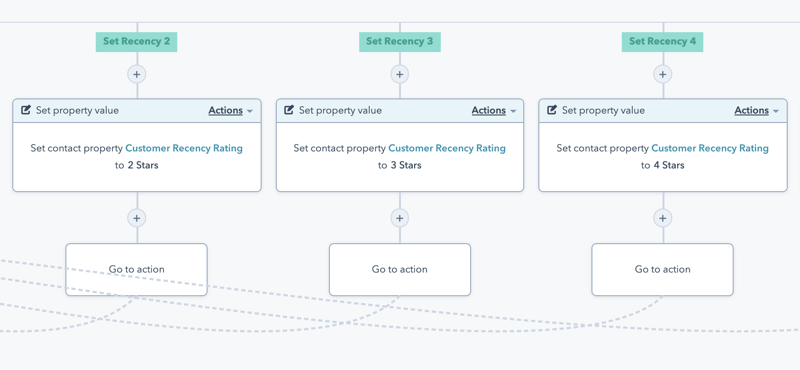
Below each of those recency actions set the "Customer Recency Rating" to the correlating "Stars" number (don't worry about "Go to action" for now.). The "No" action at the furthest left will intentionally be left blank:
Below where you set "Recency 1" add another "If/then branch" looking for "Total Number of Orders is equal to 1". On the "No" side select "Clear Property Value" for the field "Customer Segment" (which will make sure customers who've bought 2+ times will no longer have a "New Customer Designation"). On the "Yes" side create a new "if/then branch" which I'll discuss in the next section:

Here's the criteria for that "if/then branch" under the "Yes" side of the "Total Number of Orders is equal to 1" (this is where you'll set the "Customer Segment" for these new one-time orders):
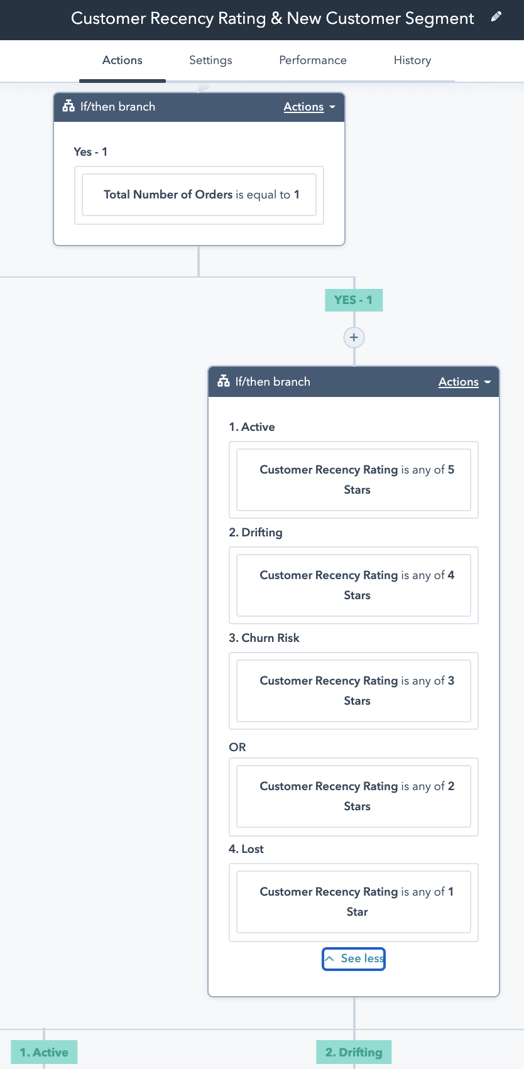
Again, you can label the branches as shown above so that the next steps are easier to visualize:
- 1. Active
- 2. Drifting
- 3. Churn Risk
- 4. Lost
And note that "Churn Risk" contains an "OR" criteria, with "Customer Recency Rating is any of 3 Stars" OR "Customer Recency Rating is any of 2 Stars". (Again, because New Customers are less likely to repeat purchase than customers who've bought 2 or 3+ times we're going to group these into one status)
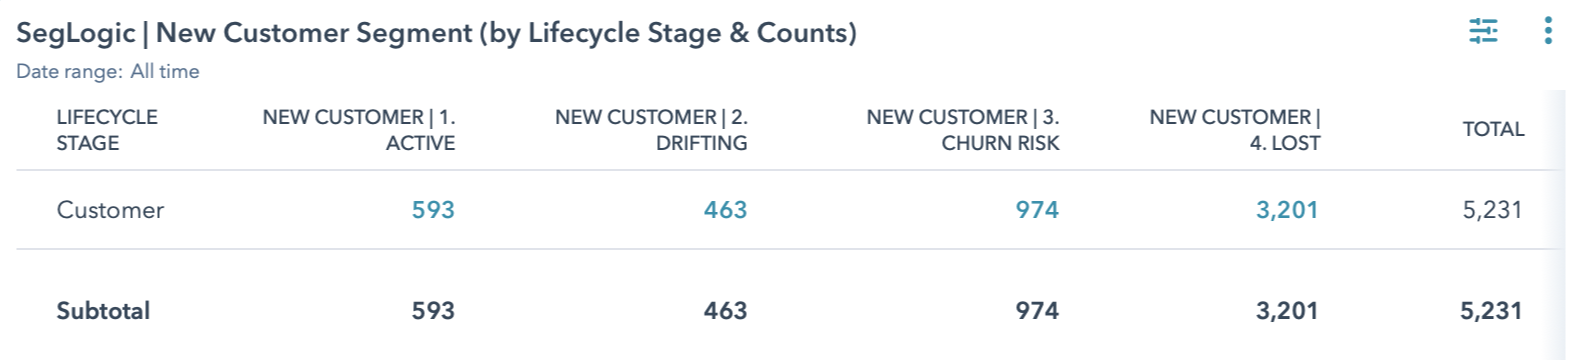
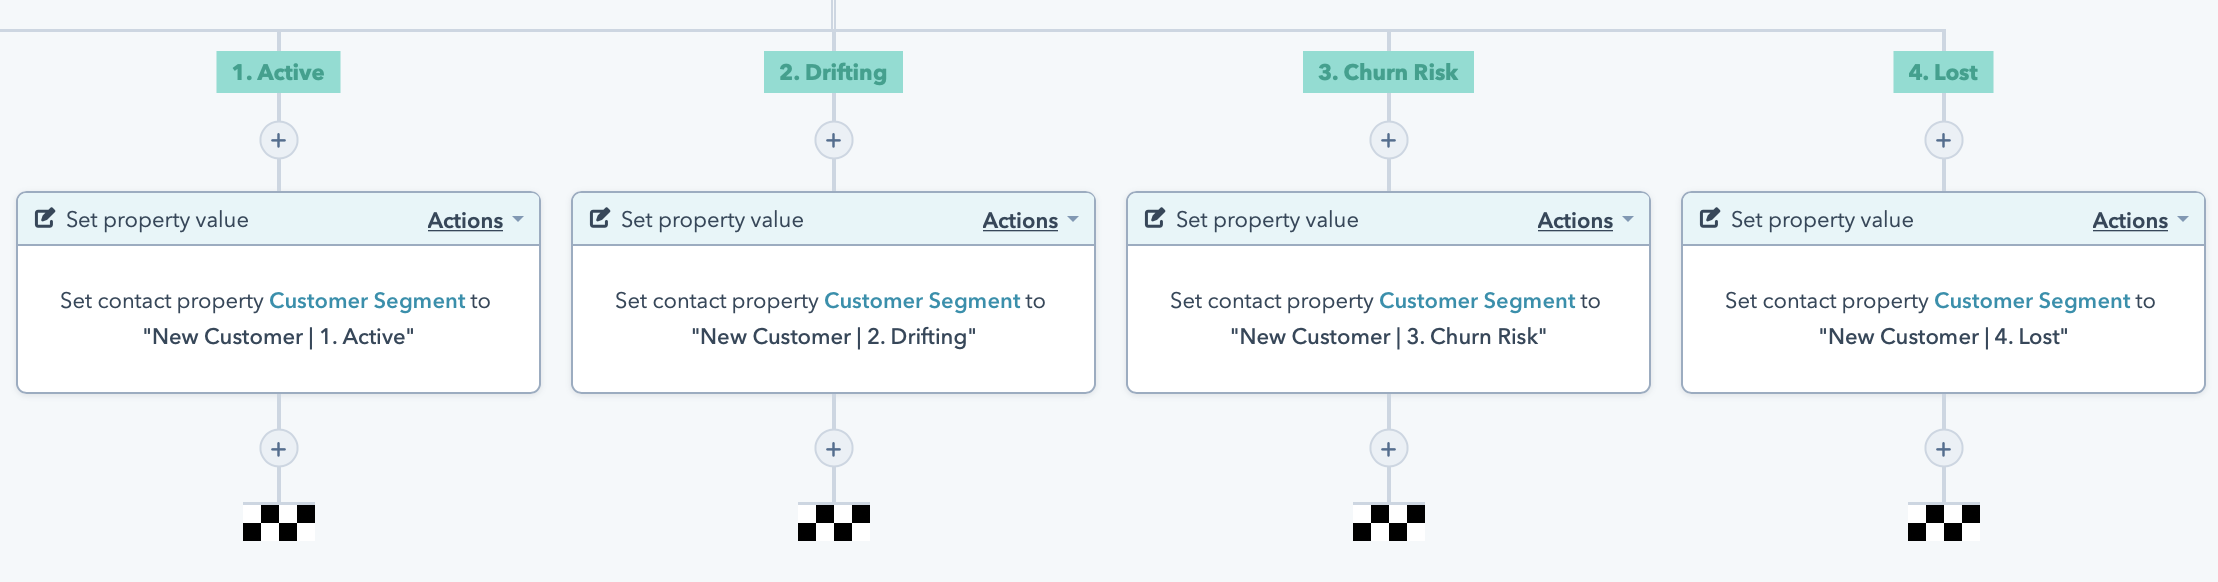
Next set the "Customer Segment" by choosing "Set Property Value" below each of those 4 items and setting them according to the following:
- New Customer | 1. Active
- New Customer | 2. Drifting
- New Customer | 3. Churn Risk
- New Customer | 4. Lost
Finally go up to where the "Customer Recency Rating" values were set and select "Go to action" under each and connect them to the "if/then branch" containing "Total Number of Orders is equal to 1":
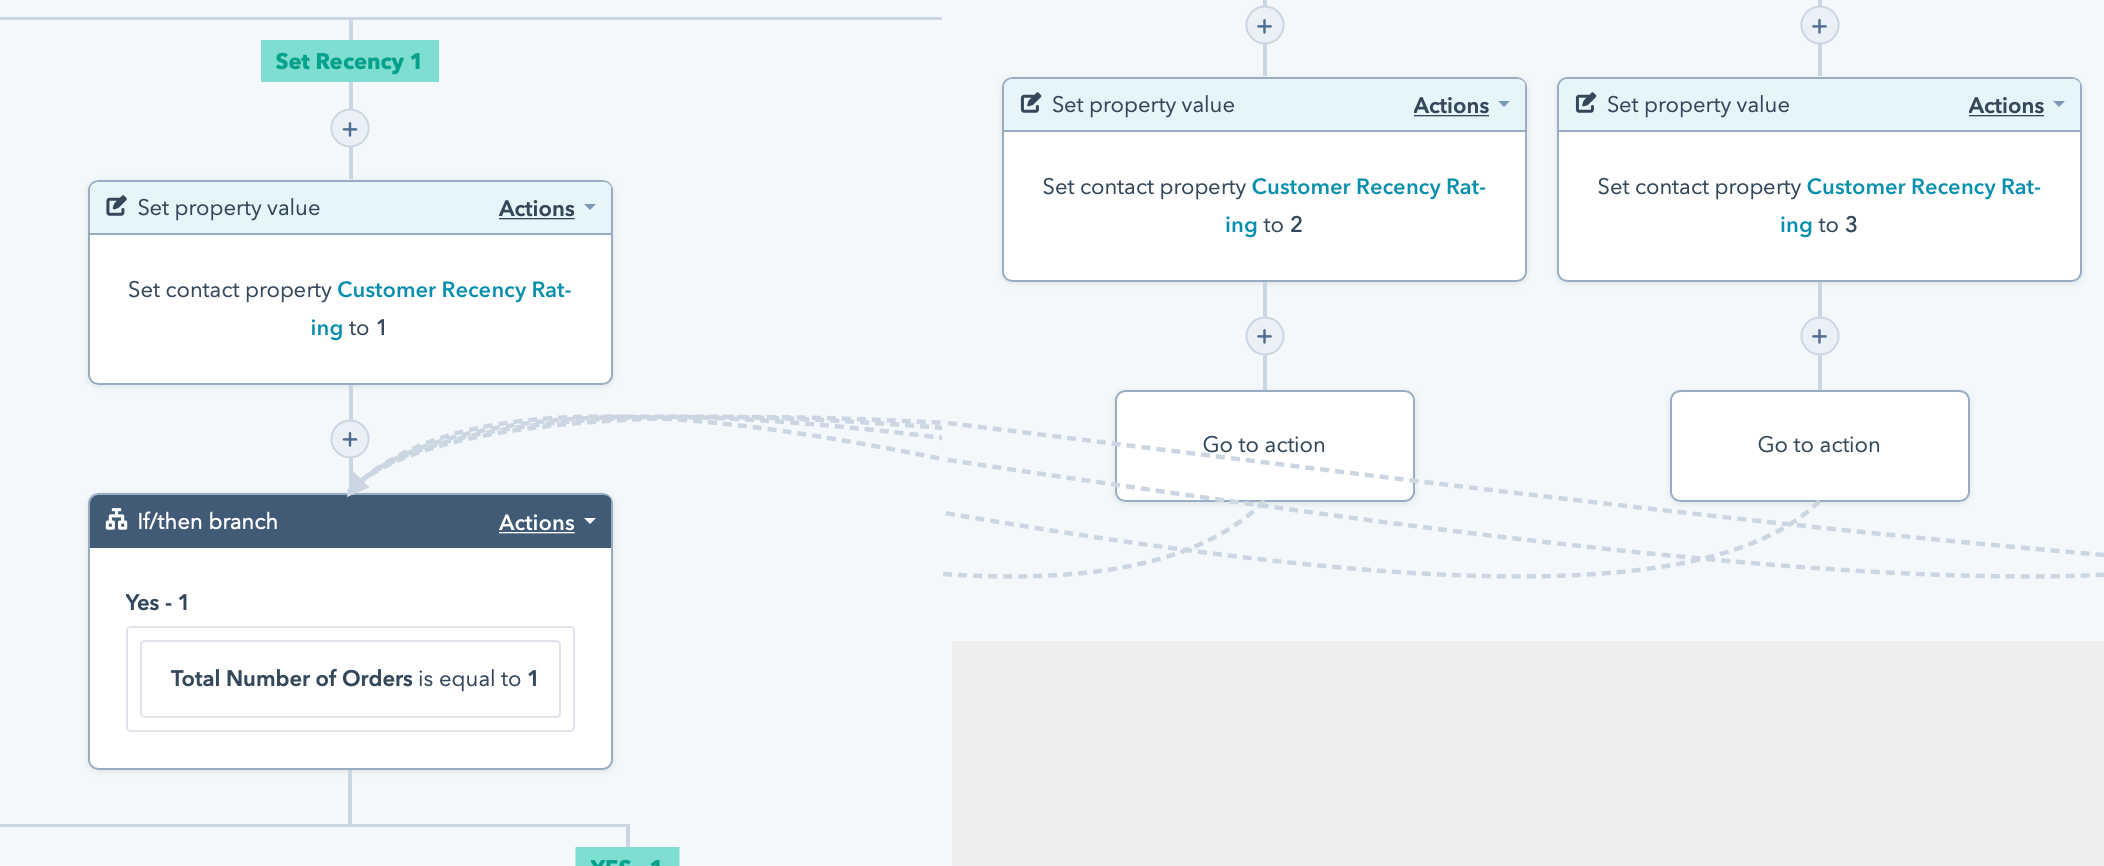
This will merge Recency 2-5 to the rest of the workflow so that they can continue to be evaluated after the value is set. (Here's HubSpot article on "Go to action" if you're unfamiliar with how it works)
Now the workflow is all set!
In the top right click the orange "Review" button and select the option "Yes, enroll existing contacts who meet the trigger criteria as of now". This will set the values for all current customers in your HubSpot account:
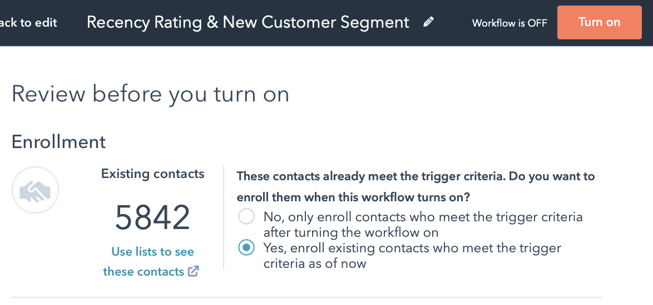 This workflow only sets property values and doesn't trigger any Emails so you don't need to worry about anything.
Click the orange "Turn On" button in the top right and now the workflow is live! It's retroactively classified all previous customers, and it'll set all new customers in the future.
Now onto reporting!
Step #3: HubSpot Reporting
I've discussed similar reporting methods in my Part 1, Part 2, and Part 3 of Ecommerce Reporting, so if you read those then this should be pretty familiar.
If not, I'll run you through the steps without providing some of that context to make it simpler. Here's HubSpot Report Creation article as a background.
Open the HubSpot Dashboard you want to create the report in and click the orange "Add Report" button in the top right then click the grey "Create custom report" button. (Or from the "Reports" menu just click "Create custom report" in the top right)
From the "Create Custom Report" window follow these steps:
- Click "Single Object"
- Click "Contacts" and "Next"
- Name the report in the top center "New Customer Segments" or something like that
- Under the left "Properties" section click "Add Contact Property" and add "Customer Segment"
- Click "Filters" in the top left and change the default "Create date" to "First Order Date" and select "is all time" instead of the default "is this: quarter so far", then "Update filter"
- Click "Add Filter" below and add "Total Number of Orders" is equal to '1' and "Apply filter"
- Click the orange "Next" button in the top right to get to the "Visualization" tab
- Select the "Table" visual chart type ("Configure table" should say "Summarized data table", so keep it that way)
- Drag "Lifecycle Stage" into "Displaying"
- Drag "Count of Contacts" into the "Add more data to display" box
- Drag "Customer Segment" right below "Lifecycle Stage"
- Click "Display options" in the top right and check "Show totals column"
- Click the orange "Save" in the top right and add it to your Dashboard (or just save the Report and add to a Dashboard, later)
That's it! Now you can visualize all of your New Customer segments.
Though I'm not covering it in this article, you can also clone and modify this report to display other metrics including "Total Value of Orders", even in a "Pie Chart" type format.
You can also break it down according to "Original Source" if you wanted to see, for example, a difference in how "Paid Search" New Customers performed versus "Organic Search".
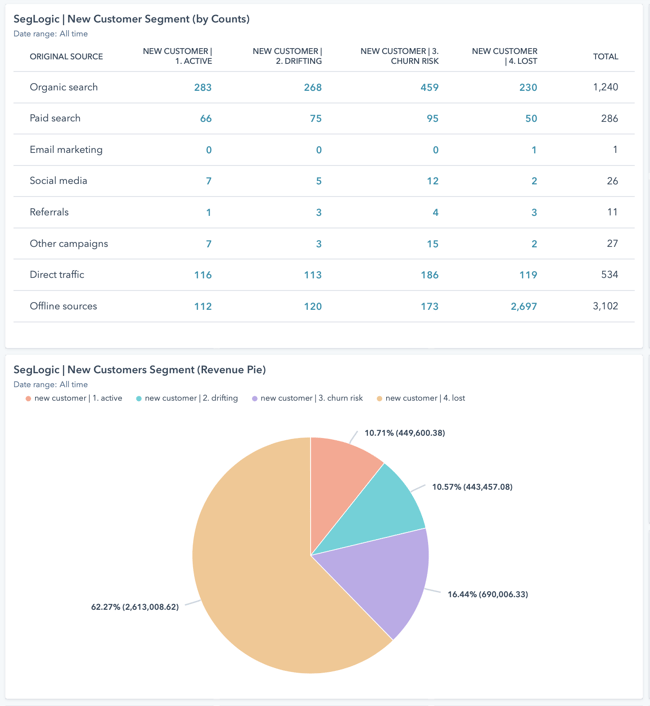
There's many different ways to visualize this data to be valuable to marketers.
You can use these "Customer Segment" values to build lists to evaluate, or trigger email-sending workflows to follow up with these contacts.
Updating Your Segment Data
Periodically, you'll want to update these list criteria as your business grows and your customer behavior changes. A "Recency 5" might become a longer or shorter period over time, for example, and your segments should reflect this change.
You can automate this process in HubSpot using our Customer Journey Analysis and automation tools if you don't want to evaluate your data and build this workflow setup on your own.
Otherwise, you can manually update the date criteria as needed in the 4 lists for queuing Recency 4-1 (leave "Queue for Recency 5-1 | Last Order >0 Days Ago" alone; that one includes all contacts and will always stay the same).
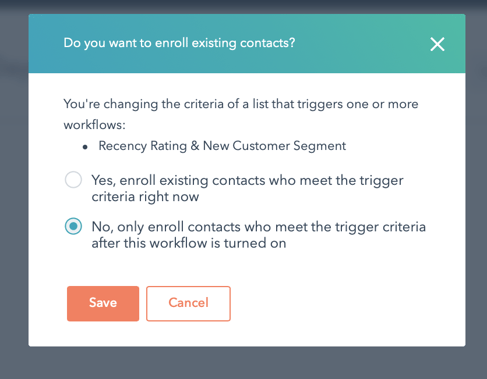
When you change the date values in the other 4 lists and click the orange "Save" button in the top right, you will see this prompt. It doesn't matter much if you accidentally click "Yes", but click the lower "No" option because you're going to run all contacts through the workflow in a later step:
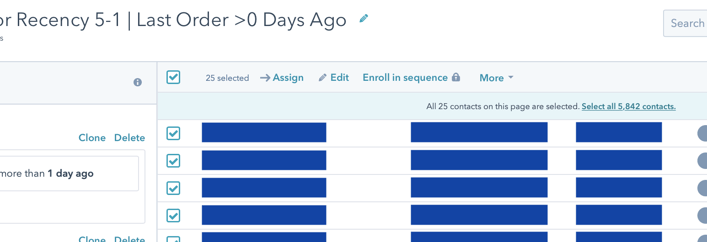
Once you've updated this on the 4 lists for queuing Recency 4-1, go into "Queue for Recency 5-1 | Last Order >0 Days Ago" and click the checkbox at the top of the contacts to select all contacts (then click the "Select all X contacts" in the blue bar so you have all contacts selected, not just the ones on the page):
Finally, click the "More" dropdown and select "Add to static list". You'll put them into the static list "STATIC RECENCY RE-ENROLLMENT LIST":
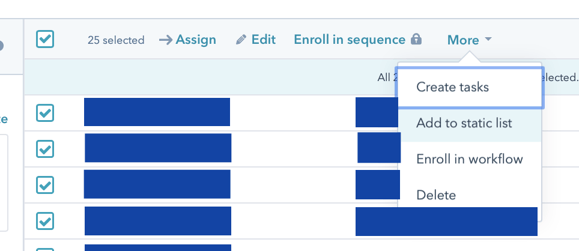
Once you've added them to this list, it will enroll all contacts into the Workflow since this is a trigger criteria with re-enrollment. And because removing contacts from this list is the first action in the workflow, all contacts will be immediately removed so you can do this again as needed in the future.
Understanding your customer data should never be a mystery for Ecommerce marketers and store owners and I hope this guide has been helpful to give you the visibility you need.
Get a Free Customer Journey Analysis!
Identify actionable differences in your Ecommerce customer behavior to focus your marketing efforts. Our subscription eliminates many workflow and report building steps from this article.

