
Using less than an hour of time, this article will help you find the gaps in your marketing strategy and see which sources are best or worst at converting customers.
In this third and final reporting blog, I'll walk through the site visitor and lead stages of your HubSpot Ecommerce reporting. Up until now, Part 1 and Part 2 focused exclusively on post-sale reporting that only looks at existing customers (using Unific's First Order Date) as the required date filter Report metric.
I want to make sure you can problem solve your campaigns BEFORE your leads even become customers. Since only 1% of site visitors turn into customers, it's extremely important to monitor the potential improvement points of your lead acquisition campaigns and see which sources are performing best or worst.
This will let you dig in and figure out why. Or, in the case of Paid Search/Social, might cause you to pull back spending in one area in favor of something that's performing better.
Custom "Purchase Rate" Properties
HubSpot has "Count of Contacts" built into all of their native reporting so that you can count the amount of contacts represented in each Paid Search, Customer Group, Persona, Form Submission, or Original Source report (Or whatever other custom Dropdown Select or Single-Line Text property you want contacts grouped by in a "Summarized Data Table" Report).
Oddly though, HubSpot does not have an "Count of Contacts"-equivalent metric for a "Count of Customers". They definitely don't have an Ecommerce-specific metrics like "Repeat Purchase Rate", which is critical for our industry since repeat purchase rates are usually 50% or lower.
Using a Marketing Hub Workflows and custom properties, we're going to set up your conversion tracking for these initial and repeat sales.
Custom HubSpot Contact Properties to build (here's how to create custom Properties in HubSpot) and you can put them in any Contact Property Group you prefer:
- Count of Customers [Reporting] - Property type: Number, Formatted Number
- Lead to Customer Rate [Reporting] - Property type: Number, Formatted Number
- Repeat Buyer Rate [Reporting] - Property type: Number, Formatted Number
- Count of Repeat Buyers [Reporting] - Property type: Number, Formatted Number
- Repeat Buyer Status [Reporting] - Property type: Dropdown select (values noted, below)
- 1st-Time Buyer
- Repeat Buyer
Now you can apply these to Workflows, with some explanation, first.
Tracking Your "Repeat Purchase Rate"
In the original article, I stated how using an Average Number of Orders can approximate a repeat purchase rate across your different groups. The reason this is an "approximation" is because if the majority of your customers have 1 order but one particular customer has something ridiculous like 25 orders, this can raise that average and not really give you a true sense of your repeat purchase data.
Using some basic math if we set the "Repeat Buyer Rate [Reporting]" to "1" for all customers who've placed at least 1 order, and set it to "2" for all customers who've placed 2+ orders, then an average will give you your ACTUAL repeat buyer rate for each segment.
It won't matter anymore if a customer has placed 20 or 100 orders because we're only going to look at a value of "2" for calculating your average.
(Note that "Repeat Buyer Status [Reporting]" won't be used for these "Summarized Data Table"-type reports and are more useful in visual graphs like Pie Charts or Area Charts, but I want you to have this value saved for other reports you'd build in the future.)
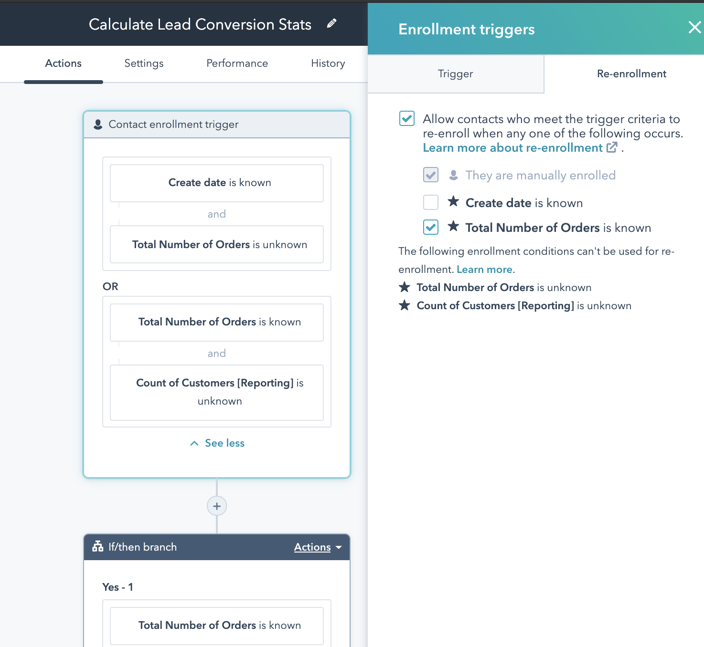
Now create a blank Contact Workflow and name it "Calculate Repeat Buyer Stats" or something like that. Here's the Trigger criteria:
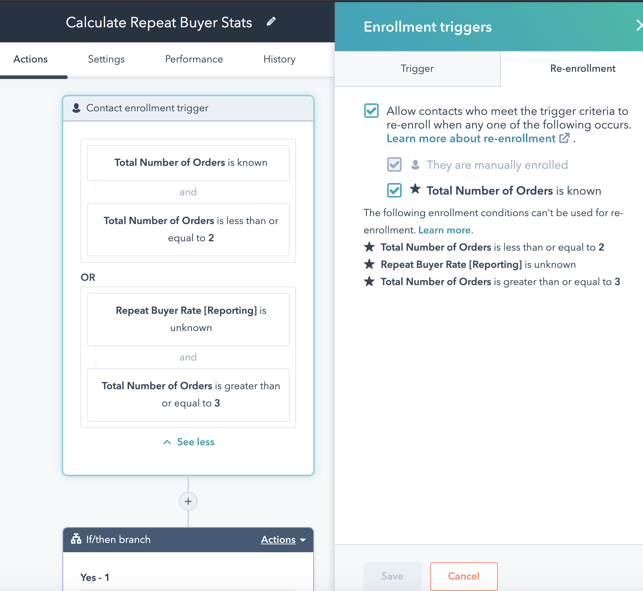
Setting re-enrollment for "Total Number of Orders is known" allows the workflow to re-calculate these stats every time that field increases (or decreases) and setting "Total Number of Orders is less than or equal to 2" makes sure that the workflow doesn't waste time re-processing contacts who already have the "Repeat Buyer Rate [Reporting]" set to 2.
That final "OR" criteria is so that you can retroactively set all qualifying contacts when you launch this workflow or for historical contacts if you haven't had Unific run a historical import yet.
As you might have seen in that last screenshot, the next step is to set an "if/then branch" to see if the customer has ordered 2 times or more, so copy the settings in this screenshot below:
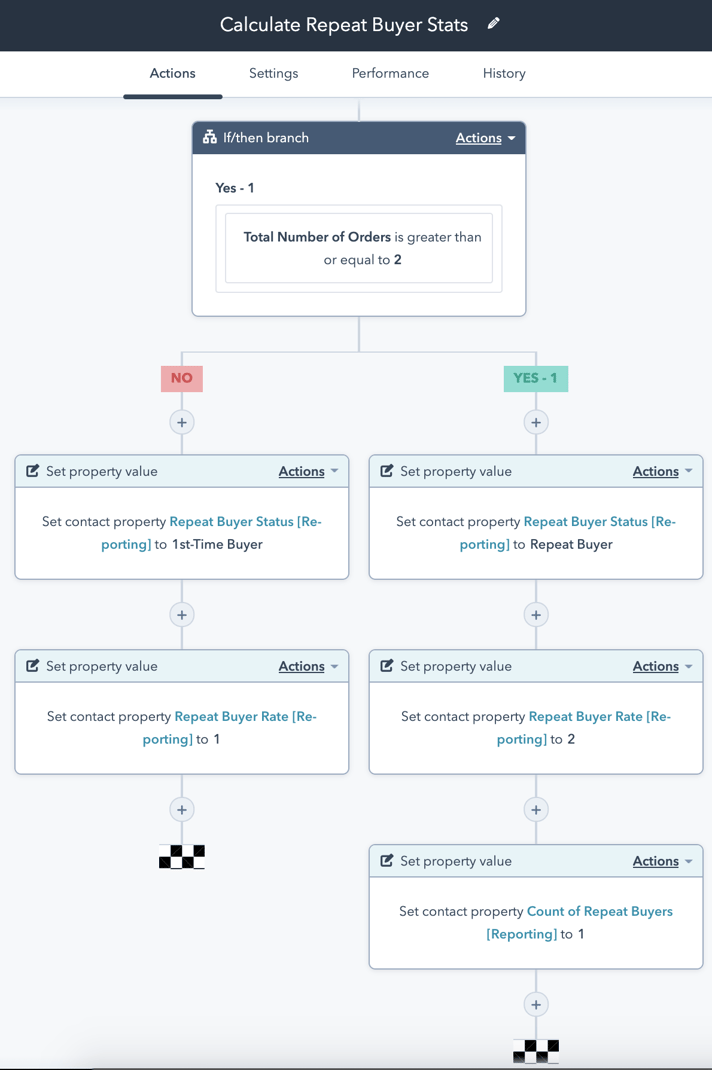
This makes sure that all of the fields will be properly set when a customer buys, as well as get updated when they move from a 1st-time buyer to a repeat buyer (or set them down if they make a return on their 2nd purchase and go back to being a one-time buyer!)
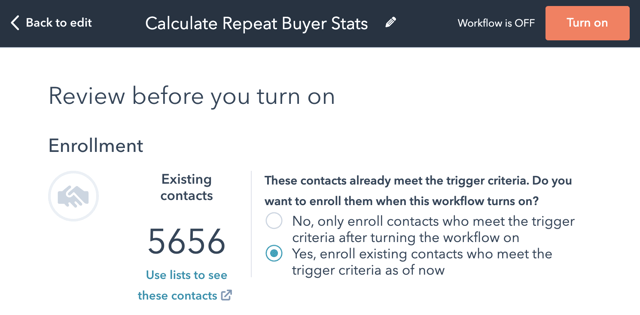
Now click the orange "Review" button in the top right and on the "Enrollment" section and click "Yes, enroll existing contacts who meet the trigger criteria as of now" because you want to retroactively apply this to all contacts from your Ecommerce history.
Finally click the orange "Turn on" button (we're only updating field values within HubSpot, don't worry, this doesn't send any emails out or anything).
I'd now recommend taking this "Repeat Buyer Rate [Reporting]" property and replacing it as an Average for the "Average Total Number of Orders" column that you have in any existing reports you built from my Part 1 or Part 2.
This will now be your accurate repeat purchase rate number across each segment:
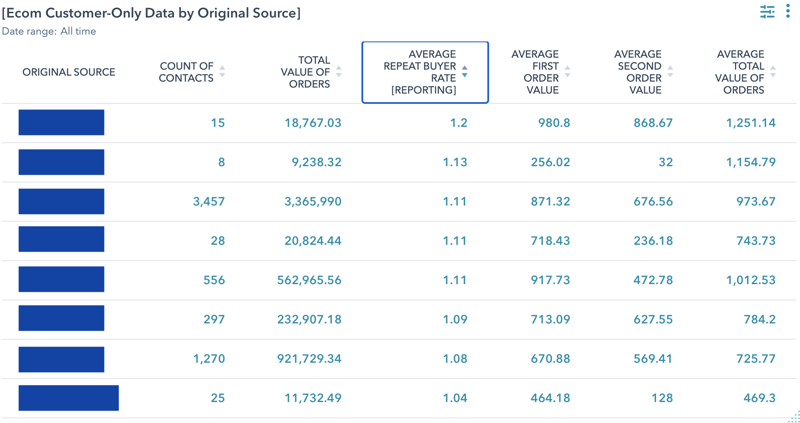
Note that HubSpot doesn't allow custom formatting of columns so we can't format this column as a percentage. When you see "1.2" just know this means "20%", and "1.09" means 9%", and so on.
Cut off the '1' and the remainder is the percent of repeat buyers.
Tracking Your Customers and Rates
Using a similar method to the section above, we're going to provide some reporting metrics for your number of leads to customer conversion stats. Again, HubSpot has many ways to keep track of lead lead conversions, but unfortunately none that will show up in these "Summarized Data Table"-style reports.
Similar to the math in the previous sections, we'll set the "Lead to Customer Rate [Reporting]" to "1" for all leads who haven't placed a cart order and set it to "2" for all leads who've placed orders per Unific's Total Number of Orders property. This will give you an actual lead conversion rate average for each segment.
And since HubSpot's reports provide a "Count of Contacts" for reports but not a "Count of Customers", we're going to build the latter using the workflow.
Now create a blank Contact Workflow and name it "Calculate Repeat Buyer Stats" or something like that. Here's the Trigger criteria:
Setting re-enrollment for "Total Number of Orders is known" allows the workflow to re-calculate as soon as your lead makes a shopping cart purchase and switch their stats to customer-oriented ones.
The second "OR" criteria makes sure that this Workflow doesn't run every time your customer makes a subsequent order and only sets those stats once.
(Note that if you DO keep track of customers in ways besides your shopping cart, this workflow will need to be a bit more complex and need to take into account HubSpot's Lifecycle Stage property, but I've built it for the standard setup where all customer sales are processed through your cart.)
Per the screenshot above, the next step is to set an "if/then branch" to see if the customers' Total Number of Orders is known (which Unific populates upon a cart purchase), so copy the settings in this screenshot below:
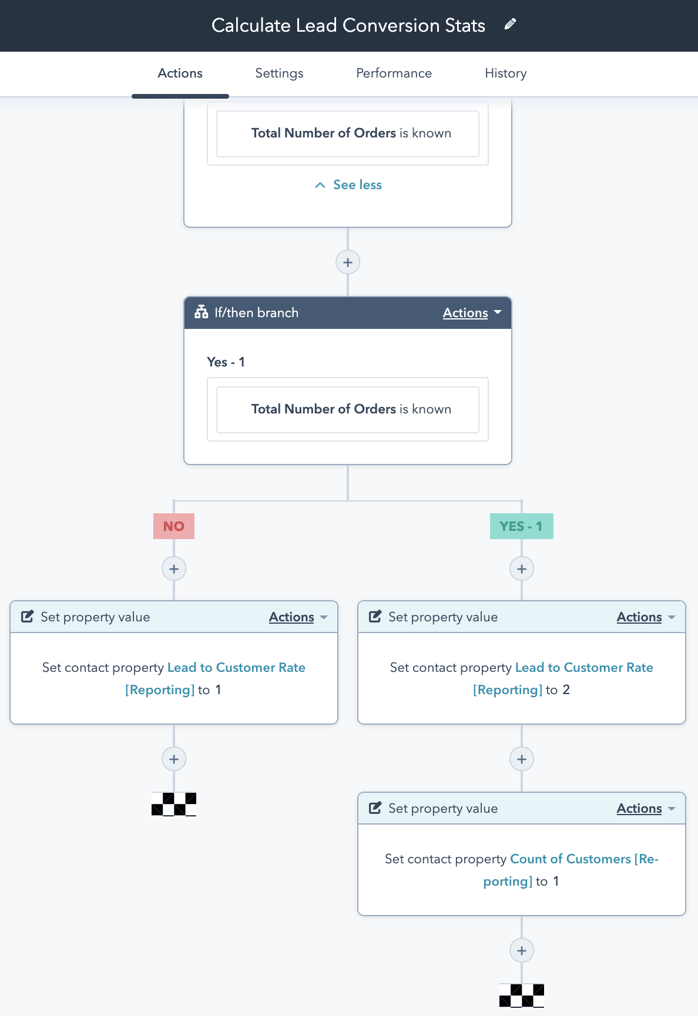
This makes sure that all of the fields will be properly set when any new contact comes into your system who hasn't yet bought in your cart, as well as get updated when they place their first shopping cart purchase.
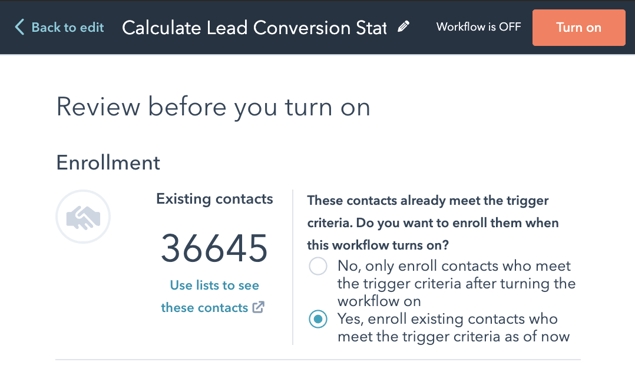
Just as before, click the orange "Review" button in the top right and on the "Enrollment" section and click "Yes, enroll existing contacts who meet the trigger criteria as of now" because you want to retroactively apply this to all contacts from your Ecommerce history.
Finally click the orange "Turn on" button (this will enroll ALL of your HubSpot contacts but again, don't worry; we're only updating field values within HubSpot and this doesn't send any emails out or anything).
Now we can build some custom reports using this data! But because it's unique enough from the original reports in Part 1 and Part 2, I'm going to explain it in a new section.
Building Pre-Sales Reports
You can modify the "Quick Ecom Dashboard for Paid Search" from Part 1 as a way to build this report.
You can clone the Report from your existing dashboard and give it a new name. Maybe call it "[Ecom Leads Data by Paid Search: UTM Campaign Name]" or something like that.
Edit the Report and follow these steps:
- Under "Filters" in the top left for "Required Filters" select "Create Date" instead of "First Order Date" (you're now looking at all contacts who may not have bought yet!)
- Make sure the "Create Date" range is set to "All Time" (you can change this range in your dashboard view as needed)
- Underneath the "Data" tab click "Add Contact Property" and add the following properties you've created (we will leave off "Count of Repeat Buyers [Reporting]" and "Repeat Buyer Status [Reporting]" to save space but you can add them as needed):
- Count of Customers [Reporting]
- Lead to Customer Rate [Reporting]
- Repeat Buyer Rate [Reporting]
- Click "Next" for now at the top right to go to "Visualization", then drag in these properties as "Averages" (except for "Count of Customers [Reporting]" which you'd want to leave as a "Total") and you can re-organize them like the screenshot below.
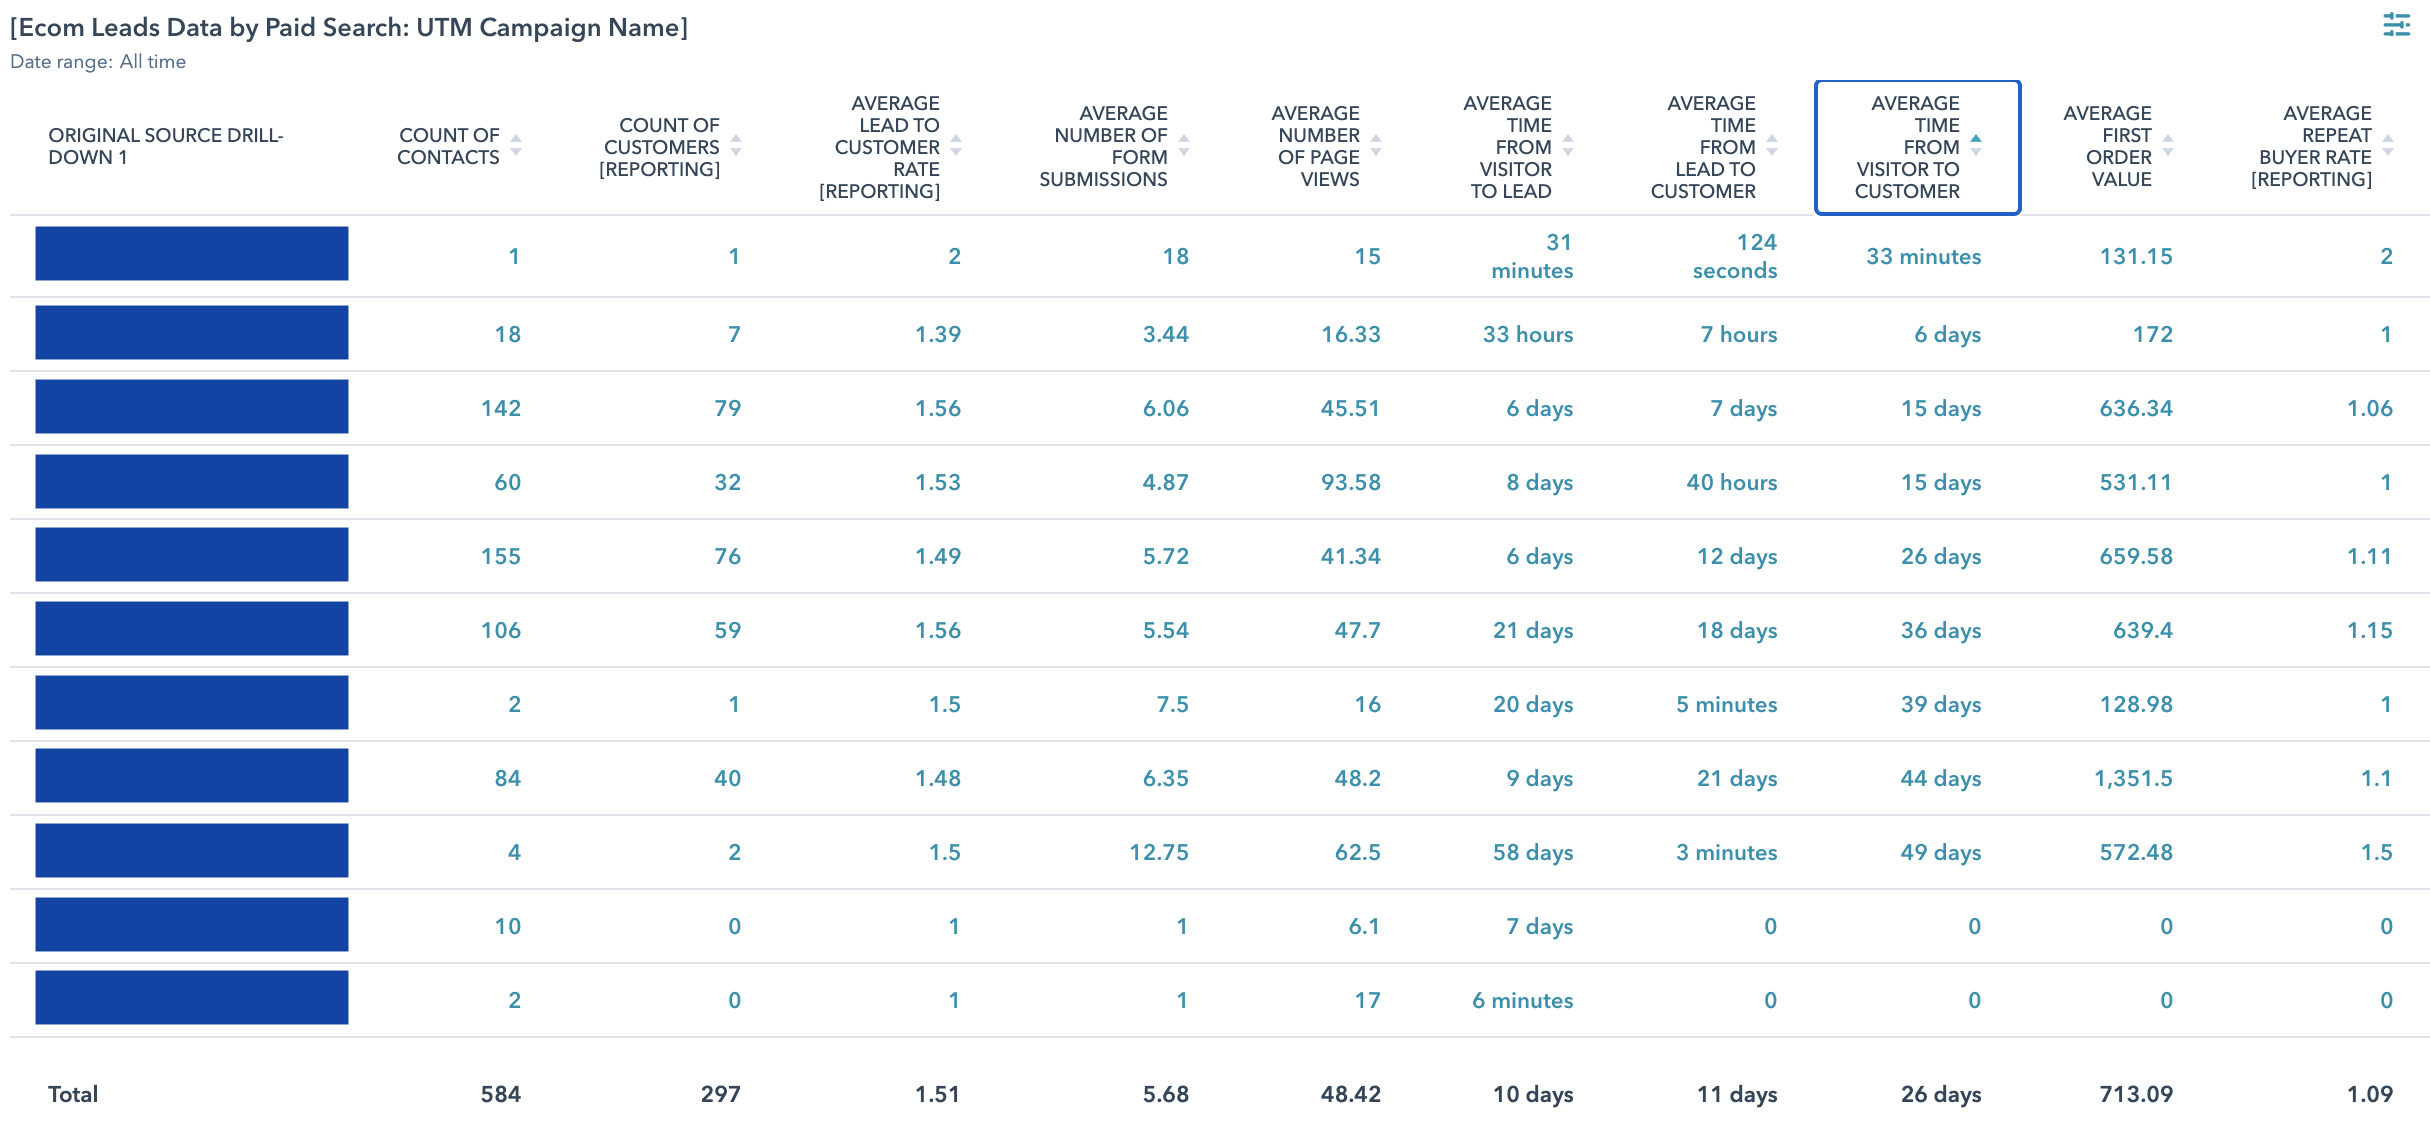
Again, since HubSpot doesn't allow custom formatting of columns as a percentage for those "Lead to Customer" and "Repeat Buyer Rate" properties, when you see "1.2" just know this means "20%", and "1.09" means 9%", and so on.
I've also gone ahead and added in a few other fields, and you can use these to understand what non-converting leads are doing and even use some metrics (like high webform submissions and site sessions) to proactively contact customers.
Native HubSpot Properties you can add in:
- Number of form submissions
- Number of page views
- Number of sessions
- Sends since last engagement
- Marketing emails delivered
- Marketing emails opened
- Marketing emails clicked
Custom Calculated Properties from Part 2 you can add in (remember you only get 5 Calculated properties in HubSpot Professional):
- Days From 1st to 2nd Order
- Days of Customer Relationship
- Time From Visitor to Customer
- Time From Lead to Customer
- Time From Visitor to Lead
- Increase of 2nd Order Value
Finally, you can use this walkthrough as a base to build the other 4 reports I referenced in Part 1 as lead-versions rather than only looking at customer data (just remember to take "Original Source Drill-down 1" out of "Displaying" in the "Visualization" tab or you'll only be looking at that data subset):
- "Original Source" | See ecom data according to all the lead source types
- "Persona" | See all ecom data according to each HubSpot Persona you've established
- "Form Submission" | See ecom data correlated with specific inbound and site form submissions (make sure to filter out all non-HubSpot forms)
- "Customer Group" | (this will only be valuable for lead data if you're basing the "Filter" on your "Account Creation Date", since any leads who don't have a store account won't have a "Customer Group" yet) See all Ecom data according to your shopping cart's Customer Group - one of Unific's Contact properties - that can break data down according to B2B, Wholesale, Retail, VIP, or other customer groups you've established
(I'll also note again that HubSpot still only has "Average" as an option for their reporting when "Median" would be better for dealing with outliers that have abnormally small or large values, so if you want to upvote that feature development you can do so, here.)
Reporting for Your Ecommerce Flywheel
You can think of this as an Ecommerce-centric dashboard for reporting on your business flywheel.
The other Part 1 and Part 2 articles give you more insight into your "Delight" stage of customer satisfaction, and now you can expand your reporting on your leads before they're ready to buy from you.
We want you to have the best possible sales growth and I hope that these three reporting articles give you insight that will set you up for a successful sales quarter!
Get a Free Customer Journey Analysis!
Identify actionable differences in your Ecommerce customer behavior to focus your marketing efforts. Our subscription eliminates many workflow and report building steps from this article.

