
Using less than an hour of report building, this article will help you understand the power of calculating "lag-time" in your HubSpot Ecommerce data to chose the best possible followup dates for your new customers.
I want you to have as many opportunities possible to pay attention to high-opportunity customer/lead source types within HubSpot that you can better serve.
In the last article I covered the basics of HubSpot Ecommerce reporting that will help you to understand your conversion data as it pertains to lifetime value and repeat purchases.
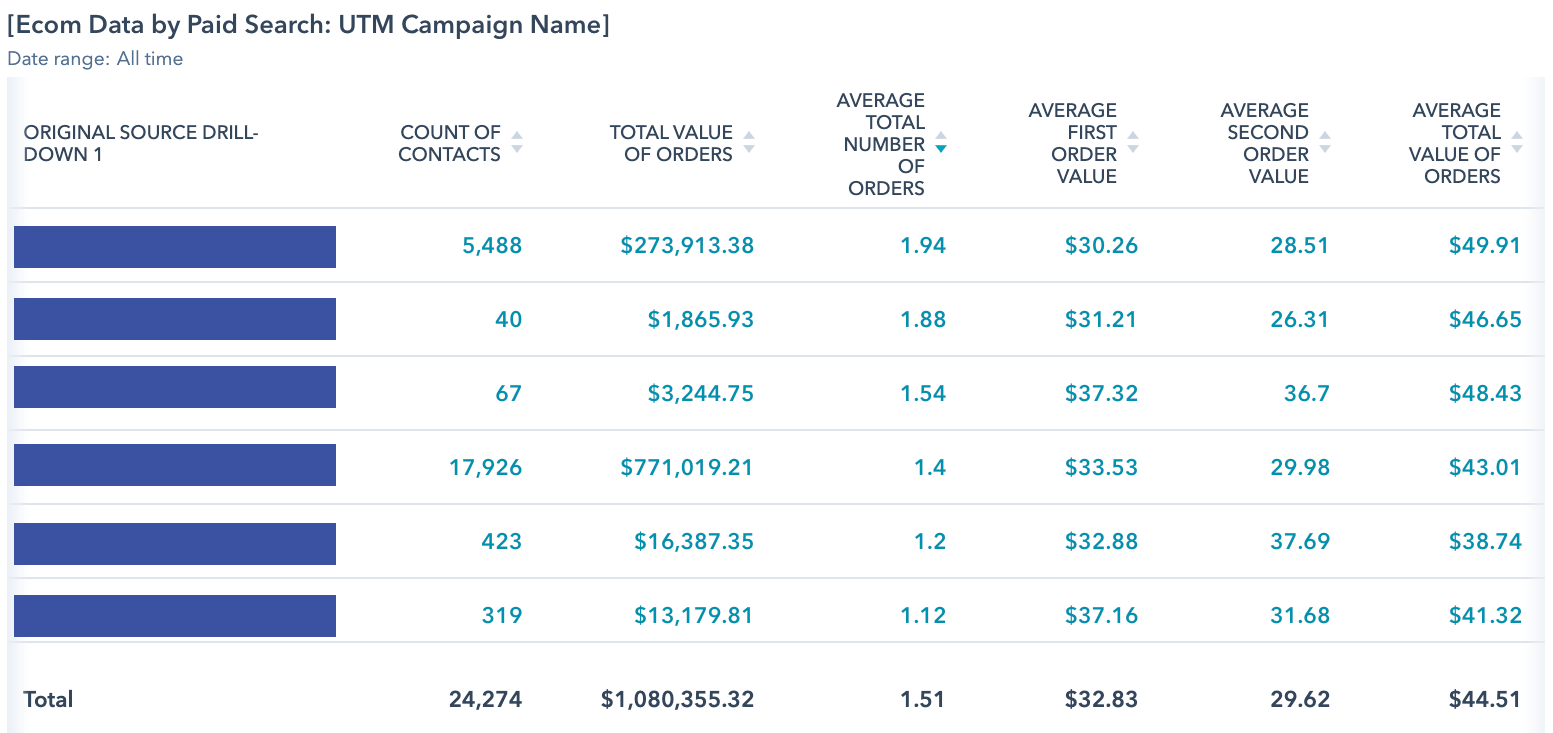
Above is an example of one of the reports, and here's the 5 total reports I covered in that article that you should be able to set up in HubSpot with less than an hour of work:
- LTV Ecom Dashboard for Paid Search Source
- LTV by Shopping Cart Customer Group
- LTV by Lead's Original Source
- LTV by HubSpot Buyer Persona
- LTV by HubSpot Form Submission Source
Again, setting up these reports are covered in Part 1 of this article.
In Part 2, I'm diving in deeper to additional data metrics that will help you understand your opportunities and gaps in your digital marketing.
I'm covering 6 different custom HubSpot properties you can utilize to understand your customer data:
- Days From 1st to 2nd Order
- Days of Customer Relationship
- Time From Visitor to Customer
- Time From Lead to Customer
- Time From Visitor to Lead
- Increase of 2nd Order Value
I'll continue this series in Part 3 which covers lead analysis in your Reports.
Using Ecom "Average Conversion Times"
"Latency" is the time it takes between two key events. In Ecommerce this is commonly utilized to understand how long customer's typically take to finish checkout, how long they typically take to make a 2nd purchase, etc.
Knowing averages of all your customers around how long it typically takes them to do a certain action is an incredibly important set of data for your Ecommerce marketing.
Unfortunately, it's not an area of analysis that's typically discussed because it is, admittedly, harder to implement.
Let's say you have a Repeat Buyer rate of 60%, which would be great for most stores! You're monitoring that Repeat Buyer rate and your sales are increasing (depending on business types this is common to see during Black Friday/holidays, back to school, and other seasonal time periods). But then all of the sudden your Repeat Buyer rate drops to 40%! Do you need to do anything about it?
You just got a bunch of new customers who haven't even had the time yet to enjoy their 1st purchase, much less consider buying again.
This is where it's important to be able to group your customers into buckets of those who have just bought and those who SHOULD have made a 2nd purchase by now, but didn't.
Being able to figure out when that threshold happens and then treat those customers as two separate groups is the essence of a "Latency" analysis.
Every retailer should have a long-term goal of raising their repeat purchase rate (which is typically below 50%). The first step is to take your data and figure out, "When do my customers NORMALLY buy again?"
You take all of your customers who HAVE made a 2nd purchase, calculate the difference between their 1st and 2nd purchase in number of days, and then that number (let's say it's 43 days) becomes the way that you can separate your 1st-time buyers into two separate groups:
- Those who've made their 1st purchase LESS THAN 43 days ago and shouldn't be considered in your repeat purchase rate (they haven't even had enough time to buy again)
- Those who've made their 1st purchase MORE THAN 43 days ago and SHOULD be considered in your repeat purchase rate (it's been enough time; monitor whether they're buying, again)
Even if 50% or more of customers will NOT buy again without making sure you stay in meaningful contact, knowing when customers TYPICALLY buy a 2nd time will help you make marketing decisions to communicate with them.
Using the example 43 days as a 2nd purchase date, if a buyer has not yet bought again but their first purchase was only 30 days ago then it does NOT make sense to offer them a discount: your data says it'll take 43 days to get a repeat purchase, so you're only risking giving away money when they might have made that 2nd purchase anyway in a few days.
Based on how long it takes for your buyers to browse your products before buying again (another latency analysis, but we won't cover that here) then it might be meaningful to send them soft reminder emails/retargeting of your product 7-10 days before that 43 day mark since they're getting close to that average 2nd purchase date.
Depending on your business this also might be the time for a proactive phone call from your sales/service team.
But it's only AFTER they've passed that 43 days since 1st purchase that you can say as a marketer, "Alright, it's been 44 days and they still haven't made a 2nd purchase so they're now deviating from typical 2nd purchase behavior. It's time for me to intervene with an offer."
The book "Drilling Down: Turning Customer Data into Profits with a Spreadsheet" is an excellent and thorough primer on analyzing order data to make marketing decisions. It's still selling for around $100 but I would find whatever excuse needed to get this book. Your marketing team will be thankful you did!
Tracking Latency Behavior in HubSpot
With that primer on "Latency", there's a few custom, calculated properties I'd recommend building in HubSpot so that you can understand your system-wide ecommerce data.
You can apply these to your HubSpot Reporting to understand if certain lead sources or customer types are behaving differently. This will help you make messaging decisions that you can implement across your marketing, sales, and support efforts.
HubSpot permits up to 5 Calculated Properties at their Professional levels (and up to 200 at Enterprise) and I'd recommend reserving those for Ecommerce-centric data!
Here's the HubSpot Calculated Properties I recommend building
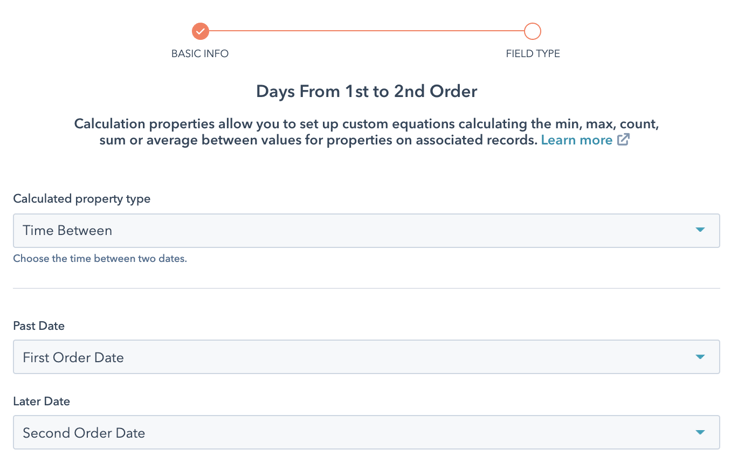
Calculation #1: Days From 1st to 2nd Order
HubSpot "Time Between" Property: First Order Date → Second Order Date
I covered this one in the last article, but now you'll have a better background for what "Latency" means and how you can use it.
HubSpot Property Creation steps once Unific's Contact Properties are in your Portal:
- Start by naming the new Contact property "Days From 1st to 2nd Order"
- In the "Calculated Property" interface, choose "Time Between" from the "Calculated property type" dropdown.
- Then choose "First Order Date" as the "Past Date"
- Choose "Second Order Date" as the "Later Date"
- Then save the property and it'll generate all values (if either property is blank then the calculated value will simply stay blank)
This is now available for adding into Reports and I described a detailed explanation of analysis in the previous section.
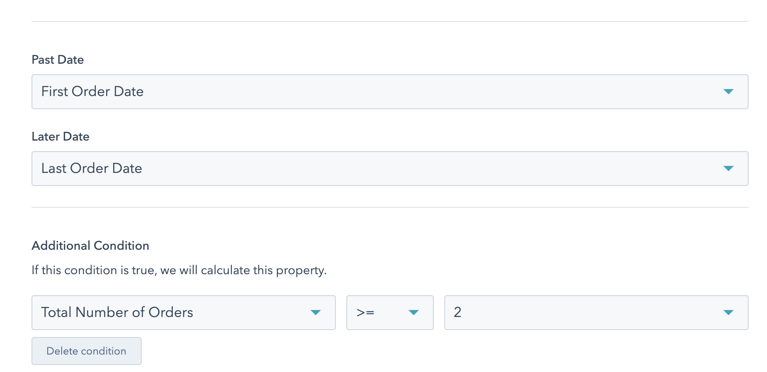
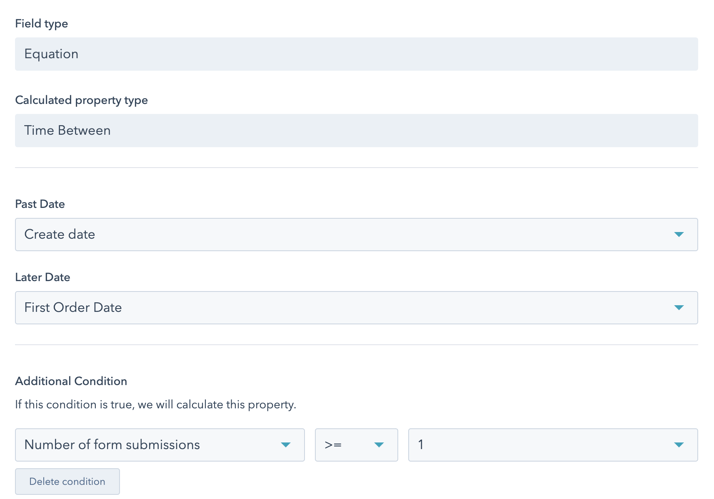
Calculation #2: Days of Customer Relationship
HubSpot "Time Between" Property: First Order Date → Last Order Date, and Condition that Total Number of Orders >=2
This property will let you know how long a customer has been your customer, from their 1st purchase to their most recent one. This is valuable in reporting to let you know how long you can expect your best customers to be in an active, buying relationship with your business.
HubSpot Property Creation steps once Unific's Contact Properties are in your Portal:
- Start by naming the new Contact property "Days of Customer Relationship"
- In the "Calculated Property" interface, choose "Time Between" from the "Calculated property type" dropdown.
- Then choose "First Order Date" as the "Past Date"
- Choose "Last Order Date" as the "Later Date"
- Click "Create Condition" at the bottom and select "Total Number of Orders >= 2" as per the screenshot (for 1st time buyers the First and Last Order Date are at the same time, which would make this value 0 days, so you want to ONLY calculate values for buyers who've bought at least twice or it'll ruin your averages)
- Then save the property and it'll generate all values
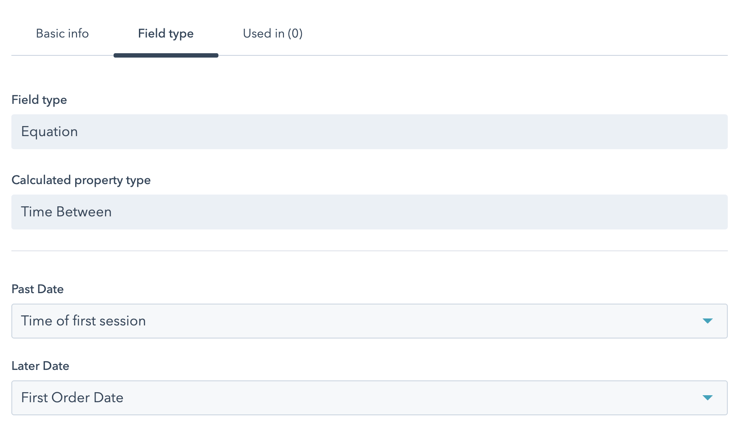
Calculation #3: Time From Visitor to Customer
HubSpot "Time Between" Property: Time of First Session → First Order Date
This property will let you know how long it takes your your buyers to make a purchase after their first time visiting your site.
Google Analytics will give you this information, but it can't keep track of that on a per-customer basis that also allows you to group that by Cart Customer Group, HubSpot Persona, Form Submissions, or the other type of data that you can only keep track of within a CRM without a ton more effort.
HubSpot Property Creation steps once Unific's Contact Properties are in your Portal:
- Start by naming the new Contact property "Time From Visitor to Customer"
- In the "Calculated Property" interface, choose "Time Between" from the "Calculated property type" dropdown.
- Then choose "Time of first session" as the "Past Date"
- Choose "First Order Date" as the "Later Date"
- Then save the property and it'll generate all values (if either property is blank then the calculated value will simply stay blank)
For an explanation of why I chose the HubSpot property "Time of first session" vs "Time first seen" you can check out this community explanation of the differences.
Calculation #4: Time From Lead to Customer
HubSpot "Time Between" Property: Create Date → First Order Date, and Condition that Number of Form Submissions >=1
This property will let you know how long it takes your leads who've signed up for your content to finally make a purchase.
If you're using HubSpot's inbound content methodology then you will have meaningful things for visitors to sign up for before they're ready to buy. Maybe it's an educational video series, or a practical PDF, or your newsletter, or even a %-off coupon popup.
This will help you know how that timeline varies across your different customer types, because customers from different lead sources engage with more content and take longer to finalize their purchase decision than other types. You can use these difference to better understand your customer pain points and hesitations to better serve them.
HubSpot Property Creation steps once Unific's Contact Properties are in your Portal:
- Start by naming the new Contact property "Time From Lead to Customer"
- In the "Calculated Property" interface, choose "Time Between" from the "Calculated property type" dropdown.
- Then choose "Create Date" as the "Past Date"
- Choose "First Order Date" as the "Later Date"
- Click "Create Condition" at the bottom and select "Number of form submissions >= 1" as per the screenshot (If a customer is created at the same time that they bought, without actually becoming a lead beforehand, then that would make this value 0 days. So although it's not perfect because it would exclude things like contact imports from trade show events who did NOT fill out a webform and doesn't filter out customers who filled out a form AFTER they've bought, this still helps to keep the number more clean and meaningful)
- Then save the property and it'll generate all values
Calculation #5: Time From Visitor to Lead
HubSpot "Time Between" Property: Time of First Session → Create Date, and Condition that Number of Form Submissions >=1
This property will let you know how long it takes from first site visit to actually signing up for something on your site.
In paid traffic, for example, this can help give you an overall view of how effective your ads are at giving meaningful calls to action that gives these paid leads a reason to sign up, even if they aren't ready to buy, yet.
Coupled with "Time From Visitor to Customer" and "Time From Lead to Customer", "Time From Visitor to Lead" will help paint an overall picture of your prospect's timelines of engaging with your content to actually becoming a buyer.
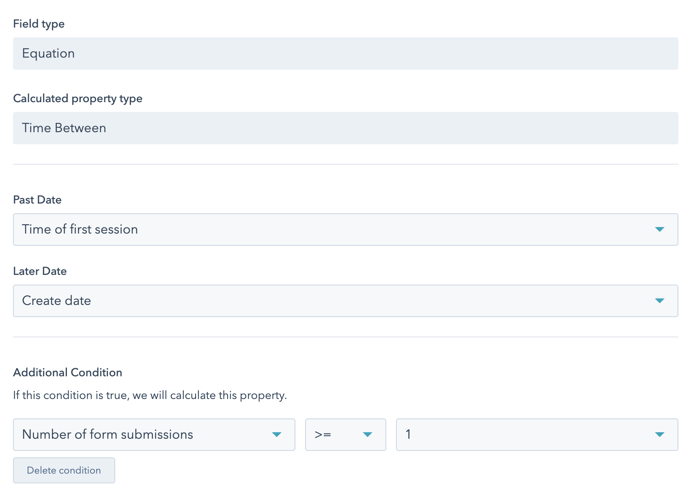
HubSpot Property Creation steps once Unific's Contact Properties are in your Portal:
- Start by naming the new Contact property "Time From Visitor to Lead"
- In the "Calculated Property" interface, choose "Time Between" from the "Calculated property type" dropdown.
- Then choose "Time of first session" as the "Past Date"
- Choose "Create Date" as the "Later Date"
- Click "Create Condition" at the bottom and select "Number of form submissions >= 1" as per the screenshot (If a customer is created at the same time that they bought, without actually becoming a lead beforehand, then that would make this value 0 days. So although it's not perfect because it would exclude things like contact imports from trade show events who did NOT fill out a webform and doesn't account for customers who filled out a form AFTER they've bought, this still helps to keep the number more clean and meaningful)
- Then save the property and it'll generate all values
Calculation #6: Increase of 2nd Order Value
HubSpot "Custom Equation" Property: Second Order Value - First Order Value
This property will make it easy for you to compare differences of 2nd order purchases among your various customer groupings in your reports.
Yes, you can have a column that contain the average of 2nd order spending, but rather than just rank the 2nd order value from top to bottom and eyeball that against 1st order values, this will allow you to calculate a direct relationship between the 1st and 2nd order value on a per-customer basis to see if there are specific lead sources or customer groups who are spending significantly more on their 2nd purchase than they did on their 1st purchase (or significantly less).
(It's also possible to calculate this as a percentage increase in spend between 1st and 2nd order purchase, but for the sake of simplicity we're going to set up a raw difference in dollars)
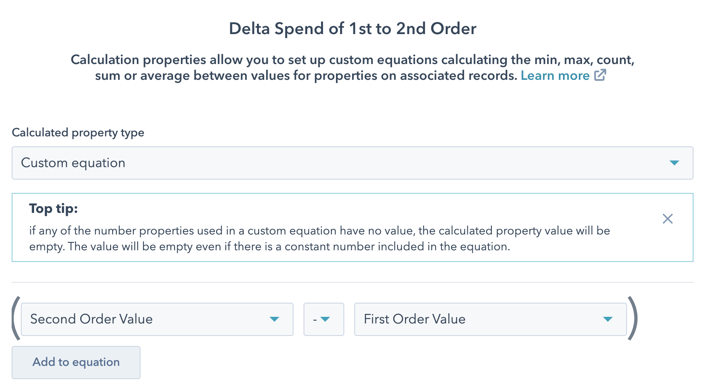
HubSpot Property Creation steps once Unific's Contact Properties are in your Portal:
- Start by naming the new Contact property "Increase of 2nd Order Value" (or "Delta Spend of 1st to 2nd Order" as I named it in the screenshot, if you want to be a 'math-geek' about it)
- In the "Calculated Property" interface, choose "Custom equation" from the "Calculated property type" dropdown.
- Then build the formula "Second Order Value" - "First Order Value"
- Then save the property and it'll generate all values (if either of those fields are blank the value will also be blank so as not to screw up your averages)
Choosing 5: Lead vs Repeat Buyer Focus
Notice I've shared 6 calculated properties but HubSpot Professional only allows for five.
It's not worth upgrading to Enterprise just for more calculated properties, so you’d have to cut one of these.
- If your business is struggling most in converting leads, I'd cut the "Increase of 2nd Order Value" property
- If your lead pipeline is fine but your biggest challenge is closing repeat purchases, I'd cut the "Time From Visitor to Lead" property
Also, I'll finally give a shoutout again to upvote the HubSpot "Median" Reporting feature. HubSpot still only has "Average" as an option for their reporting when "Median" would be better for dealing with outliers that have abnormally small or large values in order to create more accurate reports.
List of Fields Available for Reporting
Based on this article and Part 1, Here's a running tally of the ecommerce-centric fields you now have at your disposal for HubSpot Summary reports:
- Total Value of Orders
- Total Number of Orders
- First Order Value
- Second Order Value
- Days From 1st to 2nd Order
- Days of Customer Relationship
- Time From Visitor to Customer
- Time From Lead to Customer
- Time From Visitor to Lead
- Increase of 2nd Order Value
You can build these into Ecommerce-centric reports like I walked through in Part 1.
Here's some examples of some other great HubSpot default Contact properties, you can add, depending on how helpful they are to pointing out differences in the behavior of your customer segments:
- Number of Form Submissions
- Number of Sessions
- Number of Page Views
- Sends since last engagement
- Number of Marketing Emails Delivered
- Marketing emails opened
- Marketing emails clicked
Putting together these reports using Unific properties and HubSpot Calculated and native fields will create great segment and data visibility.
Get a Free Customer Journey Analysis!
Identify actionable differences in your Ecommerce customer behavior to focus your marketing efforts. Our subscription eliminates many workflow and report building steps from this article.

