
Here's some some key Ecommerce data points that you can use to build 5 different HubSpot Ecommerce reports that help identify high-opportunity customers.
One of the advantages of Ecommerce is the large amount of data a business has to work with. Digitally selling products at greater scale than you could in a physical retail store provides many opportunities for your business to optimize and improve your customer interactions all along the buyer's journey.
Conversely though, because of the large amount of data, this can lead to many gaps in your customer visibility as your business grows.
Because less than 50% of sales come from repeat buyers, I've commonly found that a business becomes unintentionally over-involved with serving their one-time buyers as they grow while not paying attention to the customer types and profiles that more naturally lead to repeat sales. (The SegLogic product we're building is a key part of addressing this visibility gap, because most native ecommerce reporting doesn't make it clear what percentage of revenue growth comes from repeat buyers nor how to target those buyer types in your marketing.)
With less than an hour of time this article will help you build a HubSpot Dashboard that can quantify the long-term ROI of your efforts to acquire new customers.
I also wrote a part 2 to this article here, along with Part 3 that covers lead analysis.
Key Actionable Metrics
Before building these HubSpot Reports and Dashboards, let's discuss some of the key Ecommerce data points you can monitor and what they can tell you about your customer base as your business grows:
- Total Value of Orders
- Total Number of Orders
- First Order Value
- Second Order Value
- Days From 1st to 2nd Order
I'll discuss these more in the later sections, but first we need to talk about how to group customers according to their financial impact on your business and what this means for your marketing efforts.
Best Customers: Small Group, BIG Sales
Per the 80/20 Pareto principle, you can count on a smaller portion of your customers leading to a much larger portion of your lifetime revenue.
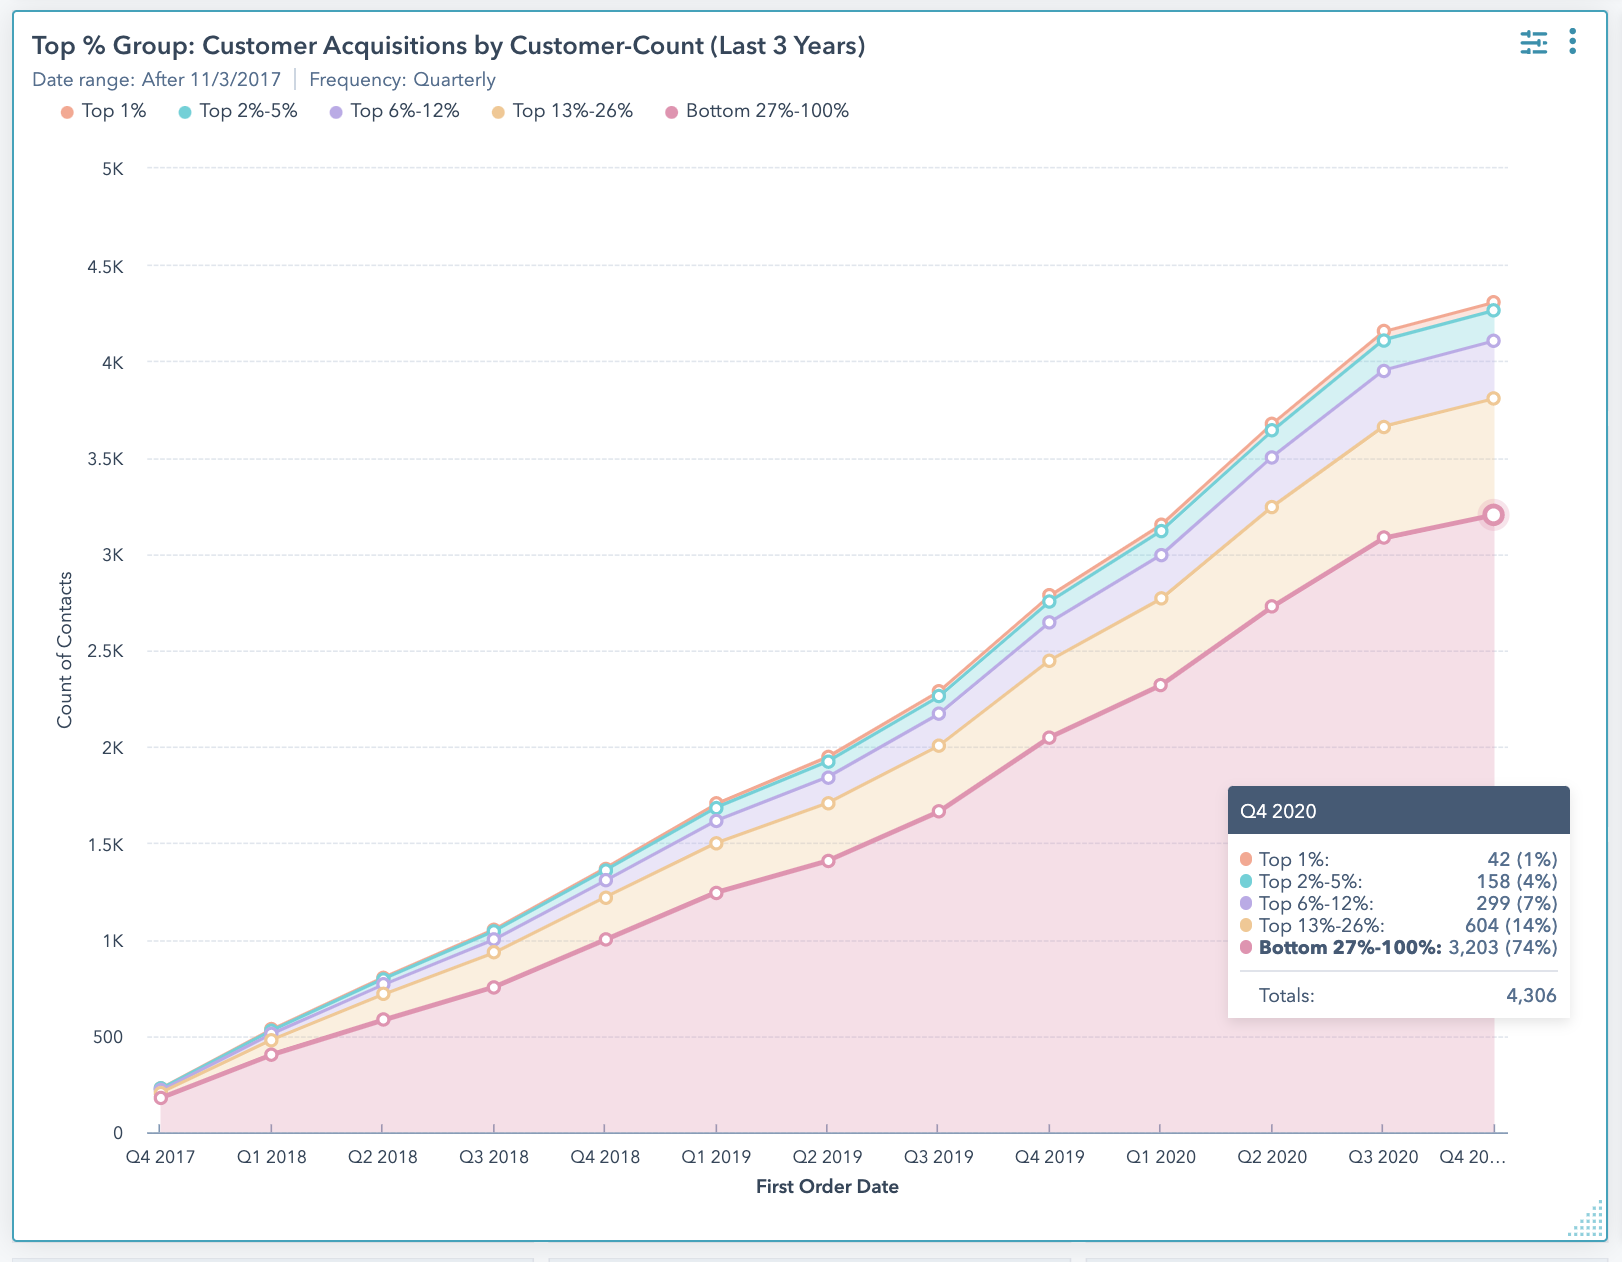
The two charts below in HubSpot are from the same business.
Out of 4,306 customers acquired in the last 3 years, we're sorting them with those who spent the most at the top and breaking them into these 5 groups
- The Top 1% of customers (42 customers)
- The Top 2%-5% of customers (158 customers)
- The Top 6%-12% of customers (299 customers)
- The Top 13%-26% of customers (604 customers)
- The Bottom 27%-100% of customers (3,203 customers)
You can see that the bottom 74% of customers (The Bottom 27%-100% group) comprises the largest group of buyers:
But now let's compare that to those customers' Total Value of Orders (their Lifetime Order Revenue):
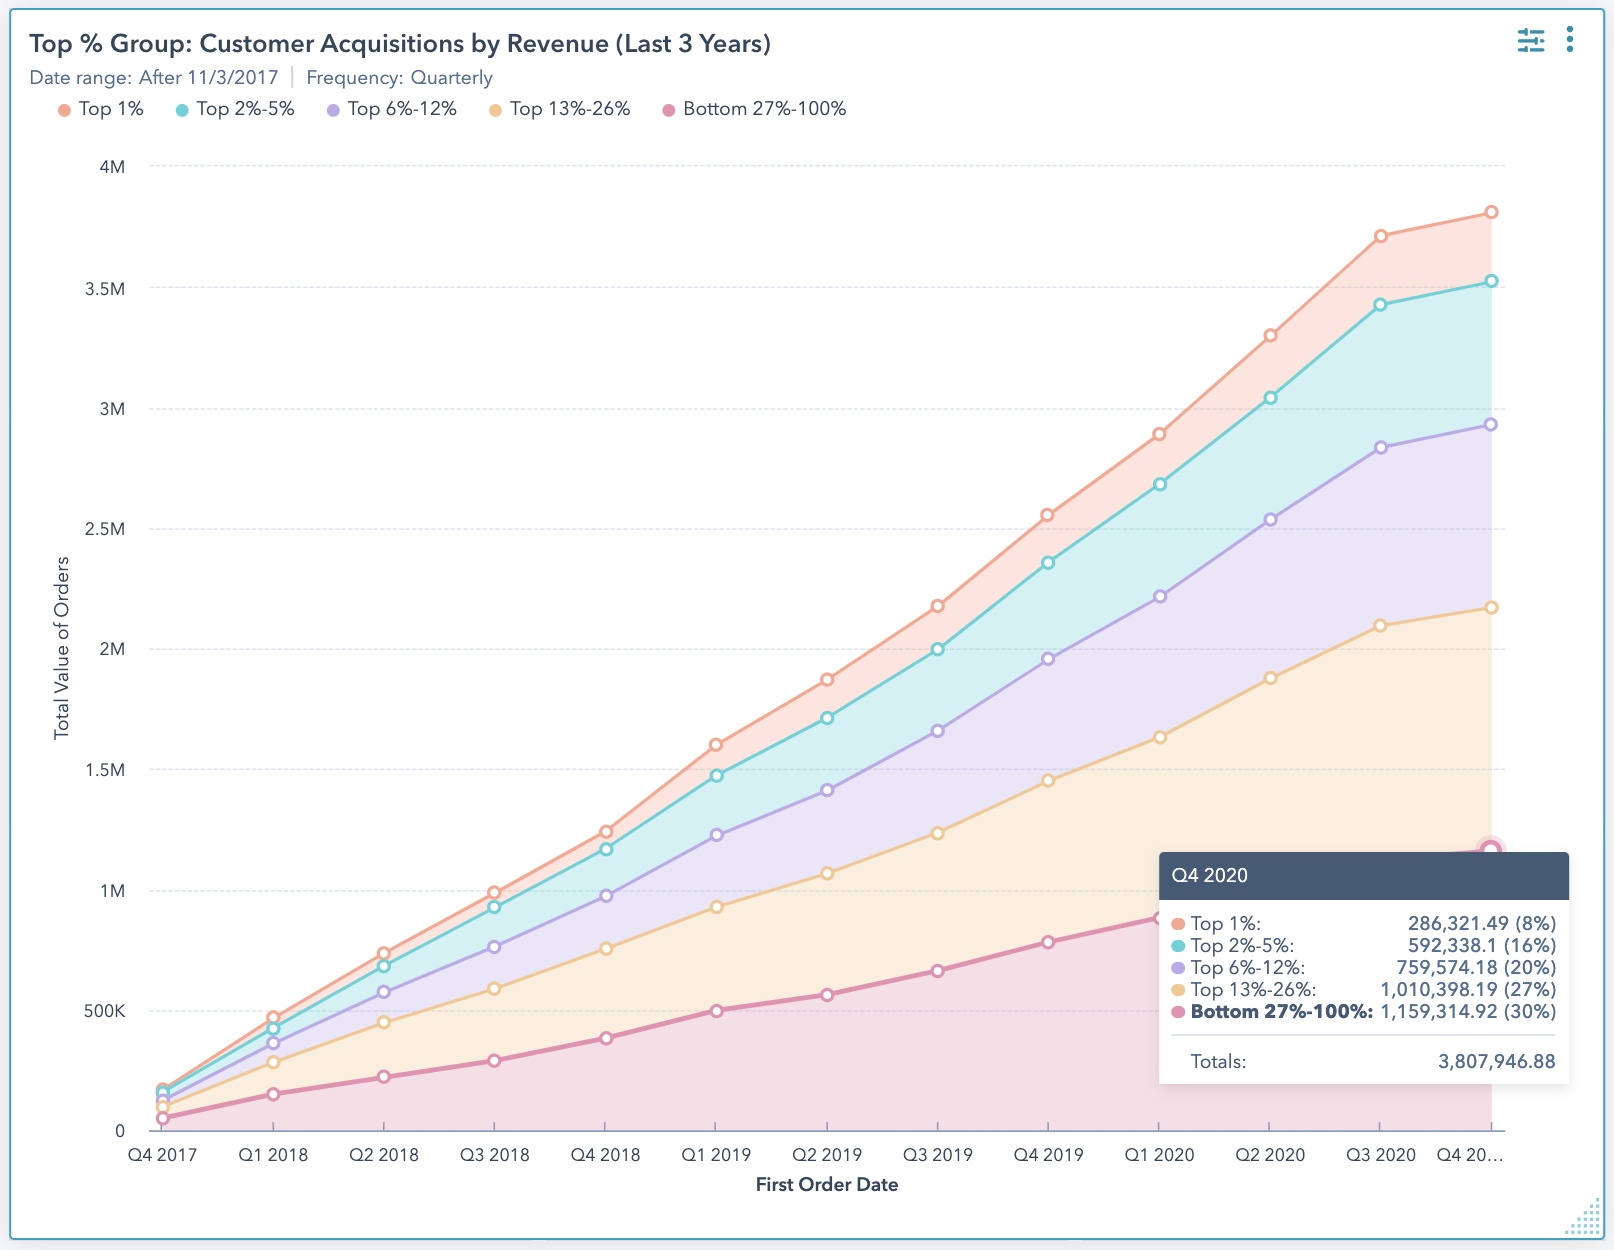
When you look at the revenue of all customers, that bottom group of 74% of all customers only comprises 30% of the Lifetime Revenue from their business over the last 3 years.
Although these 3,203 (74%) of customers will contribute greatly to the business' operations considerations, supply chain management, and fulfillment pipeline, they're only ultimately leading to 30% of the revenues that helped the business grow since Q4 2017.
This means that how the business served their top 26% of customers (only 1,103 customers, total) accounted for 70% of all their company revenue in this three year period.
This is a very common Ecommerce scenario.
This illustrates how important it is to understand and set up your buyer personas so that ALL of your lead acquisition business activities - from your content marketing, referrals, to paid ad strategies - can be positioned around attracting people with the best potential of being the types of buyers who will contribute to the majority of your revenue growth.
Let's build a report in HubSpot that will give you a sense of lifetime value for these customer sources, with a "Paid Search" report example:
Quick Ecom Dashboard for Paid Search
Google Analytics can't report lifetime value because they don't keep track of data on a per-customer basis, so this is a place where HubSpot's insights can uniquely shine as you build sales.
A particular Paid Search campaign might not initially perform for your business, but you'll be able to see over time if you're able to get subsequent orders out of these buyers that contributes to a greater lifetime value than the 1st order value would lead you to believe.
This helps retailers know if some of their paid traffic sources have a longer latency tail or take a while to pick up before just cutting the ad based on the initial order performance.
You can either add this report to HubSpot's default "Ecommerce Dashboard" (if it exists in your account, or create a new Dashboard to put this and other reports.
Here's how to build the reports:
- Navigate to "Reports->Reports" (or click on "Add Report" in the top right if you're already on the Dashboard where you want this Report)
- Click "Create custom report" in the top right
- Click "Single Object" and "Contacts"
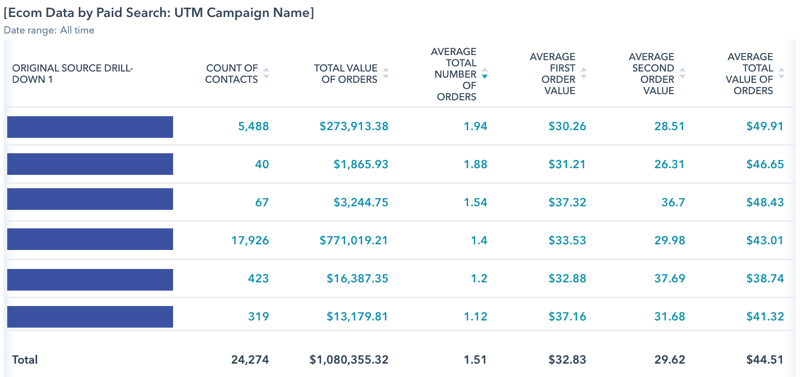
- In the top middle, title the report "[Ecom Data by Paid Search: UTM Campaign Name]" or something along those lines
- Select "Filters" in the top left
- Under "Filters" for "Required Filters" select "First Order Date" (this is the date that's considered when you select a date range in a HubSpot Dashboard)
- Change the range on "First Order Date" to "All Time"
- Under "Filters" for "Other filters" select "Original Source" is any of "Paid search" (this makes sure you can see specific ad sources; Paid Social is a distinct value, so you'd have to do this and build a second report if you want to see that data)
- Underneath the "Data" tab click "Add Contact Property" and add HubSpot's "Original Source Drill-down 1" to the list (you'll need to come back to this later to add more properties, so we'll put a pin in this for now)
- Click "Next" for now at the top right to go to "Visualization", change the type to "Table" and "Summarized Data Table"
- Drag in "Original Source Drill-down 1" to the "Displaying" section, then drag "Count of Contacts" to the "measured by" section and the Report should start to take shape
- You can "Save" this report for now and then add in the additional fields afterwards
Edit the report again and go back to Step 9 and click "Add Contact Property" till you've included these following fields:
- Total Value of Orders
- Total Number of Orders
- First Order Value
- Second Order Value
- Last Order Value
In the "Displaying" section, add all of these properties as "Averages" under the "Visualization" tab and now you've got a basic dashboard that can track lifetime and repeat sales revenue by ad source, which you can filter based on "First Order Date"!
I've also added "Total Value of Orders" as a "Total" for the first column so that you can see the overall revenue attributed to each add source. So you'd have "Total Value of Orders" on the report as both a Total and an Average, as you can see in the above screenshot.
Now that you've built this, let's dive into explaining and understanding each of these individual metrics and how you can use differences in values between each ad campaign or other "Displaying/measured by" group section:
Metric #1: Total Value of Orders
Shows the Lifetime Order Value revenue from repeat/lifetime orders from your customers who came from certain lead/ad sources (which Google Analytics can't show).
Unific syncs this Contact Property to HubSpot and it's called: Total Value of Orders
When displayed in a "Summarized Data Table" and you compare the grouped rows, this will simply let you know which group/ad source had the highest/lowest Total or Average revenue, which can help you make ad spend decisions if other campaigns are performing significantly better than others.
Metric #2: Total Number of Orders
Shows the raw orders from repeat/lifetime buyers who came from certain lead/ad sources (likewise, Google Analytics can't show this information).
Unific syncs this Contact Property to HubSpot and it's called: Total Number of Orders
Though not a true measure of your "Repeat Purchase Rate" when this column has one row showing 1.03 orders while another those 1.87 orders will tell you at a high-level which group has the higher portion of repeat buyers.
Metric #3: First Order Value
Shows a customer's first order value, and higher value thresholds are typically highly correlated to customers who make additional purchases and become part of your "Best Customer" group.
Unific syncs this Contact Property to HubSpot and it's called: First Order Value
For ads that have a significantly higher First Order Value than the other ad sources, start looking for patterns in that group's products, product options, or quantities.
You should be able to narrow down what's different about this group's buying habits, then from there you need to experiment with what it is about your offer to that audience or the interests of that specific audience that would make the purchase higher.
Insights like this form the basis of an Ecommerce-centric persona analysis that you can apply to your HubSpot account.
Metric #4: Second Order Value
It's common to see better-quality customers to make equal or higher-value purchases on their second order, so this number can help you make predictions about your revenue growth and also indicate which customers are on track to becoming high-value customers.
Unific syncs this Contact Property to HubSpot and it's called: Second Order Value
You can compare this number to each groups First Order Value to analyze patterns like this. If you a group has a substantially higher or lower Second Order Value than their First Order Value, then this would be a good opportunity analyze their 2nd purchase products, variants, quantities, and discounts, to look for patterns.
Again, this can tell you more about the buyers that come from that specific ad/group. You can use it as a "clue" that helps you figure out what their needs are that caused them to make this specific purchase choice so you can proactively serve this type of audience's second purchase in the future.
Metric #5: Days From 1st to 2nd Order
Lets you know the ideal times to upsell your customers to a second purchase, so you're neither bugging them to early nor giving unnecessary discounts.
HubSpot permits up to 5 Calculated properties at their Professional levels (and up to 200 at Enterprise) and I'd recommend reserving those for Ecommerce-centric data!
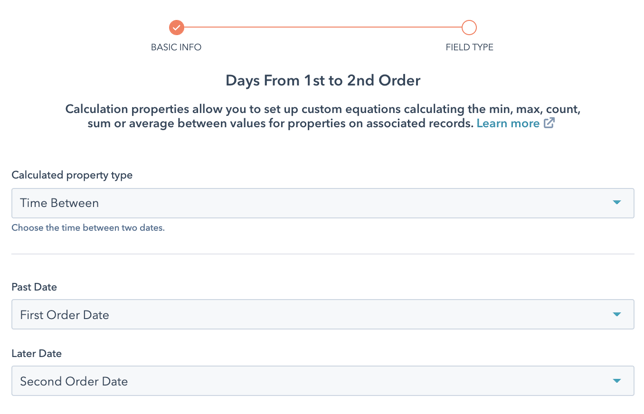
- Start by naming the new property "Days From 1st to 2nd Order" (or "Time From 1st to 2nd Order")
- In the Calculated Property interface, choose "Time Between" from the "Calculated property type" dropdown.
- Then choose "First Order Date" as the "Past Date"
- Choose "Second Order Date" as the "Later Date"
- Then save the property and it'll generate all values (if either property is blank then the calculated value will simply stay blank)
(You can also go back to the report assembly Step 9 and add in this newly created "Days From 1st to 2nd Order" property. I didn't want to include it in the original assembly instructions since it's not a native field we natively sync and I didn't want to confuse anyone)
Sort this column in your reports by most/least so that you can see which ad sources are leading to the quickest repeat purchases. Again, this can indicate whether there's something special about your offer or the buying interests of that specific audience. If you figure it out, you could put more targeted followup to these contacts down the road.
Four Additional Ecommerce Reports
Now that you've got this "[Ecom Data by Paid Search: UTM Campaign Name]" Report as a base and you understand how the individual properties work, you can clone and rename the new report to swap in these other grouping types, below.
For each new report you clone you can go to the "Data" tab and "Add Contact Property" to add the following properties to the "Summarized Data Table".
Then swap "Original Source Drill-down 1" out of "Displaying" in the "Visualization" tab to get a whole new set of insightful reports by using these other values:
- "Customer Group" | See all Ecom data according to your shopping cart's Customer Group - one of Unific's Contact properties - that can break data down according to B2B, Wholesale, Retail, VIP, or other customer groups you've established
- "Original Source" | See ecom data according to all the lead source types
- "Persona" | See all ecom data according to each HubSpot Persona you've established
- "Form Submission" | See ecom data correlated with specific inbound and site form submissions (make sure to filter out all non-HubSpot forms)
(Note: For each of those examples, also make sure to take "Original Source" must be taken out of the "Other filters" option, otherwise you'll only be looking at that subset of the data.)
Now you have a total of 5 easy-to-make HubSpot Reports that you can populate in your Dashboard!
Part 2: Repeat Buyer Rate, Etc.
This is more complicated in HubSpot so I'll cover it in a part 2, along with other calculated properties that are valuable for Ecommerce.
When aggregated in your HubSpot "Summarized Data Table"-style reporting, having a column for "Repeat Buyer Rate" will let you know what lead sources or customer types are most conducive to overcoming that 50%+ one-time buyer rate.
In Part 2 I'll cover this along with getting your "Lead to Customer Rate" into your reports for easier measurement.
(I'll also note that HubSpot still only has "Average" as an option for their reporting when "Median" would be better for dealing with outliers that have abnormally small or large values, so if you want to upvote that feature development you can do so, here.)
Laying Groundwork for Growth
I'll continue the Part 2 to this article that covers more in-depth metrics and Ecommerce reporting you can accomplish with these and more properties, across a wide variety of lead sources. I'm giving you everything you need now to start tacking this data in the background so that you can review the data and make proactive adjustments in your campaigns.
Everything in Part 2 will be able to be applied retroactively so you don't need to worry about losing out on any data while you wait. Just start implementing what's here and you've have data organizing itself in the background!
Get a Free Customer Journey Analysis!
Identify actionable differences in your Ecommerce customer behavior to focus your marketing efforts. Our subscription eliminates many workflow and report building steps from this article.

