
69.23% - that's the average cart abandonment rate as of January 2017.
How does your business compare?
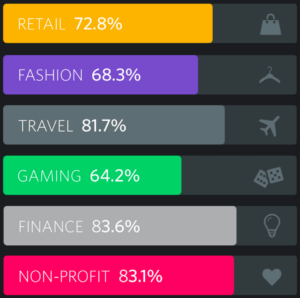
To better compare, how does your store compare to the industry standard? According to SaleCycle, the Finance industry has the highest rate of shopping cart abandonment at 83.6% while the Gaming industry boasts a leading 64.2% abandonment rate.
In this post, we'll look at how to calculate your store's abandoned cart rate with Google Analytics and how to analyze statistics for optimizing conversions.
Cart Abandonment Rate: How To Calculate
Set Up A Goal & Funnel In Google Analytics
Once you're in Google Analytics, go to the Admin > Goals > + NEW GOAL.
Next, select the "Place an order" template under Revenue then click continue.
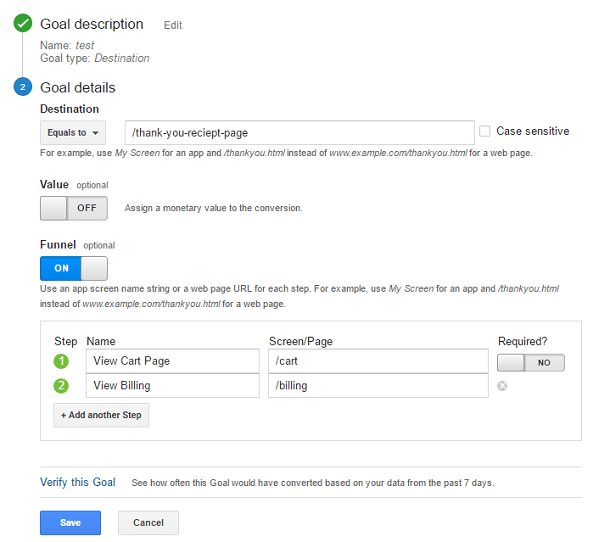
Now, name your Goal. Name your Google Analytics Goal something clear like "order placed" or "check out complete" to signify a customer has completed the order. Then select "Destination" as the goal type.
Next, input the final URL of your checkout process > turn on Funnel > customize to include the URLs of each step of your checkout process. For example, see below.
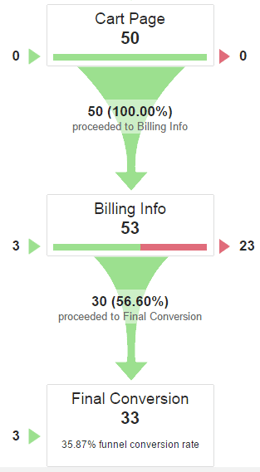
Now that you're set up to track your user's conversions, you can see the efficiency of your checkout process. To do this, go to Conversions > Goals > Funnel Visualization.
Here is where you'll see the cart abandonment rate for each step of your store's checkout process.
Have questions about setting up your Goals for Funnel Tracking in Google Analytics? Check out this great video from Google.
Cart Abandonment Rate: Tracking & Optimizing
Context Of Conversions
It's important to focus on where most customers fail to continue during the checkout process. It's often not so simple to understand why they've fallen off the process.
The context of knowing how many form fields are in each step, or how private the information requested can be in the eyes of the consumer. Some retailers see a better conversion from fewer fields in more steps, while some have improved conversion by limiting check out process steps and the total amount of information collected. It's about understanding what information is necessary, attainable, and valuable for bringing customers back for future purchases.
Testing For Optimization
Try implementing new check out characteristics; if you require a login for purchases, test letting shoppers check out as a guest. Consider adding more security information to comfort buyers, if your store is struggling to convert customers past the billing stage. If you customers feedback claims shipping fees or total costs appear higher than expected, test presenting more transparent pricing information on product pages.
Make changes, try A/B Split tests, and more but ensure you're tracking changes and the performance results. It's important to know what changes have which effects, to best optimize your site and check out conversion process.
Even the greatest of check out processes will have a problematic cart abandonment rate, that's where abandoned cart emails come into play; improving conversions with well timed messaging, offering coupon codes, and more. Learn more!
Get a Free Customer History Analysis!
Identify actionable differences in your ecommerce customer behavior to focus your marketing efforts.
