How many of us have resorted to sending the same winback campaign with the same discount coupon to all of our customers? Most merchants fall into this trap.
Given the data that’s available, merchants usually view retention as a single metric - customers are either active or lost.
Retention Spectrum is a better, more accurate way to analyze and act upon customers that are starting to drift away from you, and in turn provides a better chance of retaining your customers over the long-term.
Watch this~14-minute video discussing the insights and recommendations from an anonymized Buying Behavior Report from a $26 million dollar company.
How many of us have resorted to sending the same winback campaign with the same discount coupon to all of our customers? Most merchants fall into this trap.
Given the data that’s available, merchants usually view retention as a single metric - customers are either active or lost.
Retention Spectrum is a better, more accurate way to analyze and act upon customers that are starting to drift away from you, and in turn provides a better chance of retaining your customers over the long-term.
In the customer cultivation methodology, we discuss the pitfalls of focusing on generating the most revenue possible from every customer. When you’re trying to generate the most amount of revenue from every customer, you resort to batch and blast email marketing.
Your customers are people with their own unique hopes and dreams. They bought from you for a specific reason tied to the value they think your product provides. Your customers each exhibit their own unique buying habits, and the Retention Spectrum provides visibility to this data and helps you ultimately take data-driven actions at scale that treat your customers as unique individuals rather than just numbers on a screen.
What is the Retention Spectrum?
The retention time frame is different for many brands but in general if a customer hasn’t purchased in 12 months then they’re most likely lost. To determine the spectrum, you pick your retention time frame and find everyone that has purchased within it. We recommend your time frame be at least 12 months but at most 36 months to produce accurate data.
Afterward, you’re going to compare each customer to where they fit in relation to every other customer in the time frame. That’s where the real power of the Retention Spectrum comes into play. Rather than setting arbitrary dates, you use your actual data to see how your customer base is performing. Based on that comparison, you will determine what bucket the customer fits into. The buckets consist of active, drifting, churn risk, and lost.
- Active - Customers who have purchased more recently in the spectrum.
- Drifting - Customers who have purchased recently enough to be still aware of your brand but they’ve fallen out of the active bucket.
- Churn Risk - Customers who have purchased quite a while ago and are losing touch with your brand.
- Lost - Customers that purchased the furthest away from active in your time frame and will need a lot of incentive to reconvert.
Why is the Retention Spectrum important?
Looking at your retention as a spectrum rather than lost vs active gives you quite a bit of leverage. Contrary to popular belief, consumers don’t only care about price when making purchases. They care about the value they’re going to receive and identifying with the company they are purchasing from.
With 4 different levels of retention you’re able to focus on reinforcing value while identifying with customers before you resort to discounting. This not only saves you margin but it also prevents you from devaluing your brand and creating purchasing habits revolving around the latest promotion. It also allows you to be more aggressive with discounting for customers that need it!
How can you use the Retention Spectrum?
Taking a customer cultivation approach, you can send the right message to the right person at the right time. We’re working with a steady stream of merchants, big, small and everywhere in between.
All the merchants we work with start by requesting a free Customer Segment Report. Many then continue with our Buying Behavior Analysis. Without naming names, let’s dig into one of the more recent customers we have begun working with and see how our analysis was able to provide the data to back up their assumptions, while at the same time change their perception of why.
The company normally does around $26 million in annual revenue ended 2020 with 30% less revenue than 2019.
Rolling 12-Month analysis of all customers showing a steady decrease in revenue
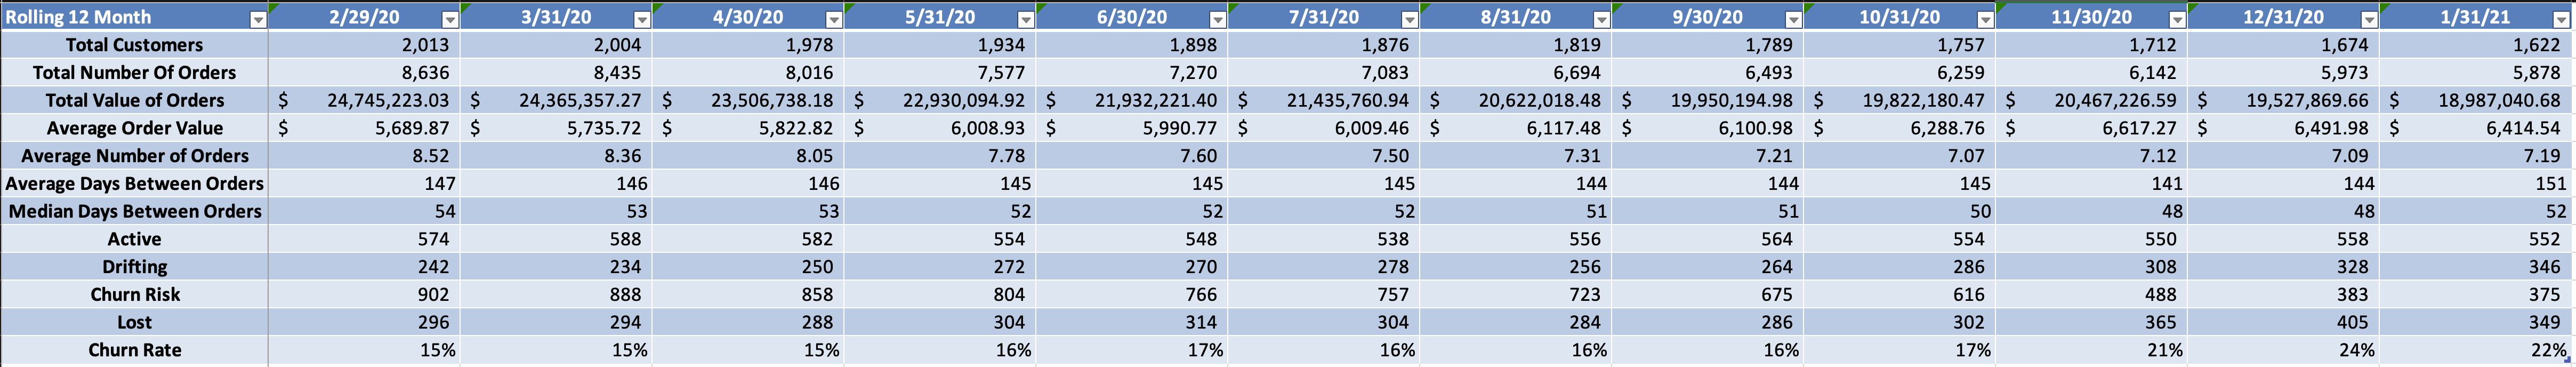
At first, this decrease didn’t make much sense since they were actually adding more new customers than ever before.
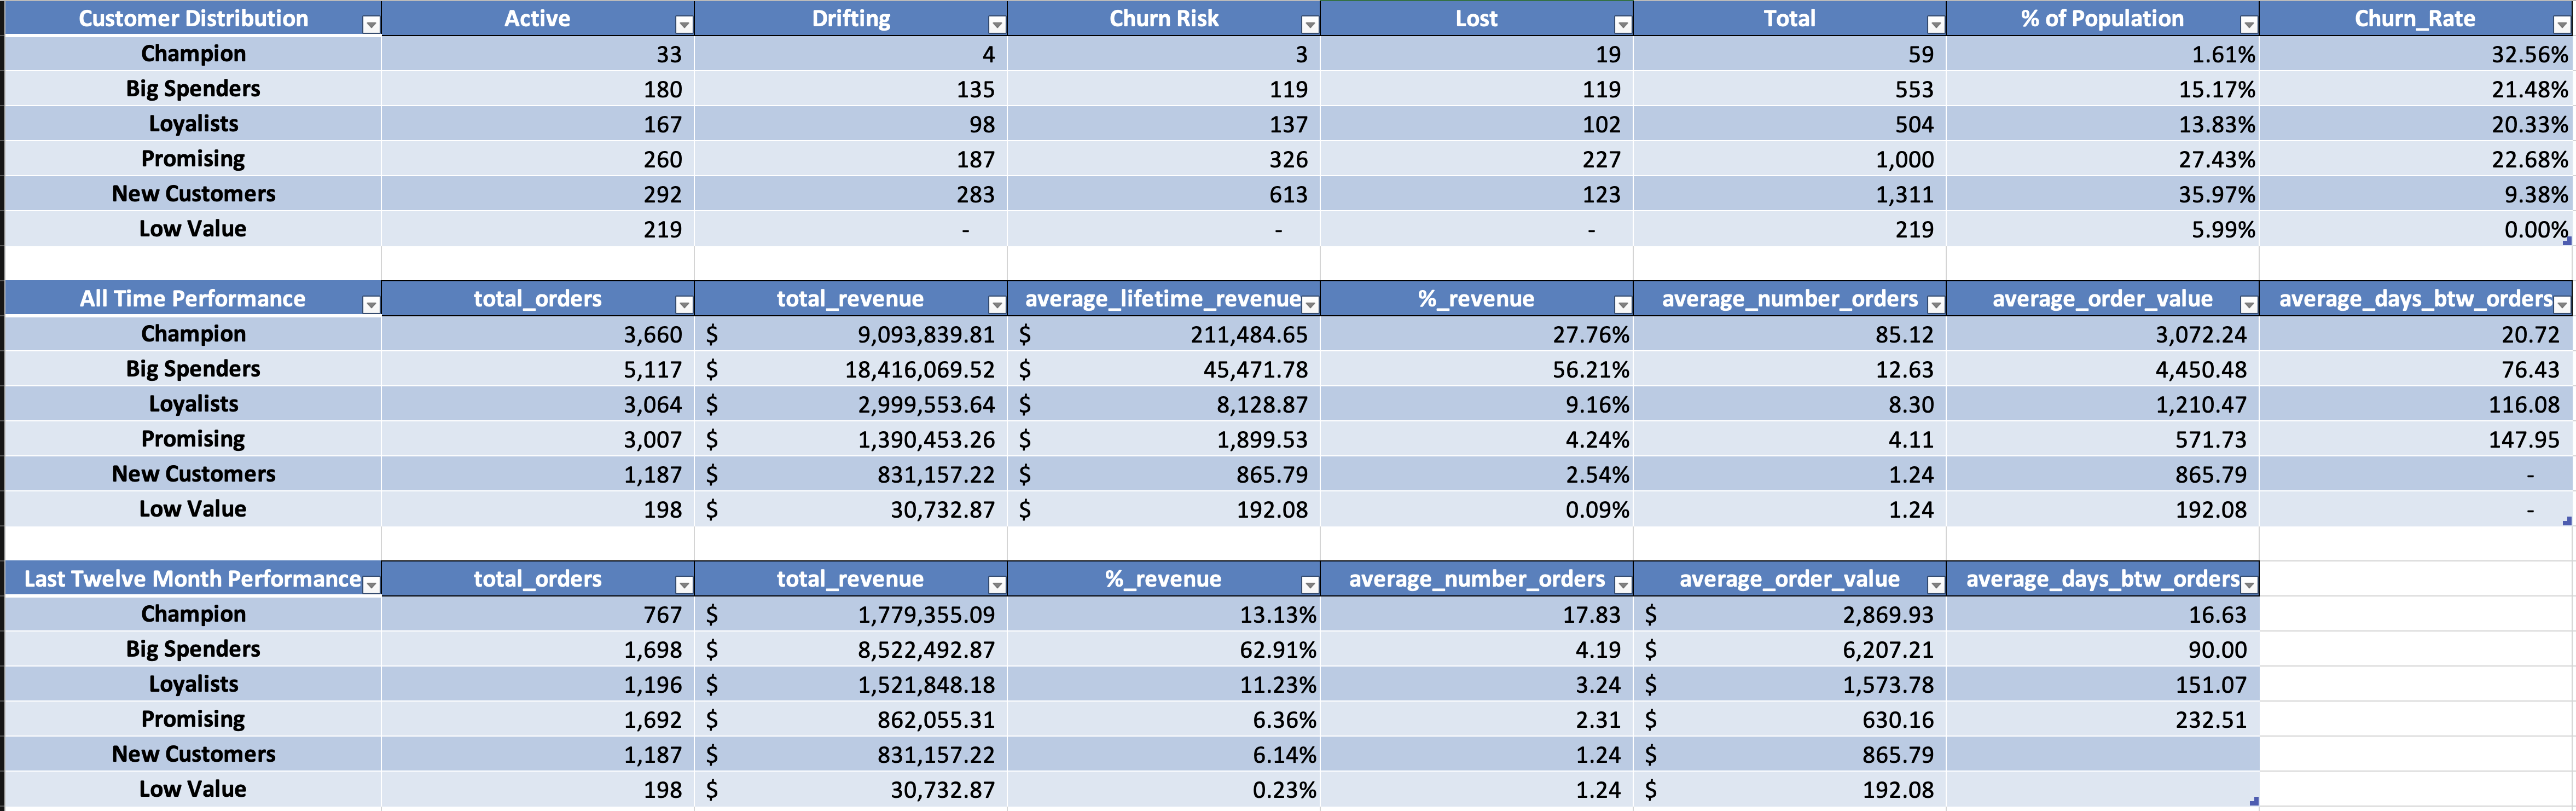
We reviewed their retention spectrum across all their SegLogic segments and found some interesting insights. They were steadily losing their most valuable, oldest customers while steadily gaining new customers that were performing poorly.
Customer Segment Report showing a high churn rate for the most valuable customer segments.
We put together a personalized action plan including one to one calls for their highest value customers combined with messaging encouraging them to re-engage with the brand. Not making the same mistake we spoke about earlier, the drifting customers will receive marketing messaging reminding of the value, churn risk customers will receive customer service emails asking if there’s anything the company can do to help, and lost customers will receive a direct phone call from an account manager to show much they company values them.
The retention spectrum not only makes it easier to keep customers engaged, it also gives you guidance on how to focus your limited time and resources.
What insights are hidden in your transactional data?
What assumptions are you making about your business performance - your revenue, profit, and growth rate? I challenge you to dig deeper and not stake your business or your job - your livelihood - on assumptions.
Request a free Customer Segment Report and start the journey of putting data behind your decisions.